Running on strong coffee, loud music, video games, & cat photos 😸
Andriana Gutierrez
👋
Oh Hey There
I am an experienced full-stack designer who thrives on solving real-world problems, working side-by-side with developers, designing scalable systems, and building accessible technology for everyone.
My process involves lots of sketching, collaboration, developing strategy, prototypes, and research to discover what drives user behavior, balancing user needs with business goals. Passionate about accessibility and experienced with defining accessibility standards, designing mobile-first, accessible (WCAG) products and services. Proud #a11y.
"Matthew Koschmann (PhD, University of Texas at Austin) is an assistant professor in the Department of Communication. His research explores the communication processes of inter- and intra-organizational collaboration, with a particular emphasis on nonprofit organizations, cross-sector partnerships and the civil society sector. He teaches classes on organizational communication, collaboration, persuasion, leadership and research methods."
Colorado.edu
Challenge
Communications, human resources, and soft skills are not commonly thought of as go-to simulation topics. Their inherently “fuzzy” nature makes it difficult to measure results and requires a well-crafted storyline.
Professor Koschmann wanted to develop a simulation that would take his communications undergrads even further into the grey area of group dynamics. He wrote a detailed storyline around a topic that challenged the decision-making and communication skills of his students: develop a fire mitigation plan for a small fictional mountain town that meets the needs of all involved.
Simulation Requirements
Developed with the team as we uncovered the main learning objectives, use cases, and goals.
Multiplayer, each team of 5–6 exists in their own world
5 rounds of play, each simulating a week of time
Each player has a unique role, with role-specific information they may choose to reveal or not during gameplay
Roles: Mayor of Town, Forest Service District Ranger, Environmental Organization Rep, Local Coalition Rep, and Municipal Water Authority CEO
Self-paced and managed by the players, who start/end meetings and choose which regions to discuss
Teams need to be able to communicate in-game
Players need to receive communications/information from their constituents
Omnipresent facilitator as a character in the story to help guide players
Interactive map of the fire mitigation area and town, 5 regions on the map, each with their own complication
3 methods of burning: Prescribed Burn, Mechanical Thinning, and Targeting Thinning
1 secret unlockable method (which I will not reveal; students google this stuff)
Group surveys to evaluate decision making and participation at the end of each round or specific rounds
Optimal scenario: creating a mitigation plan that everyone agrees on
Students write a press release together at the end of Round 5 that includes their plan and is exportable/printable for the instructor/facilitator
Final survey to evaluate the group and the Burn Plan outcome
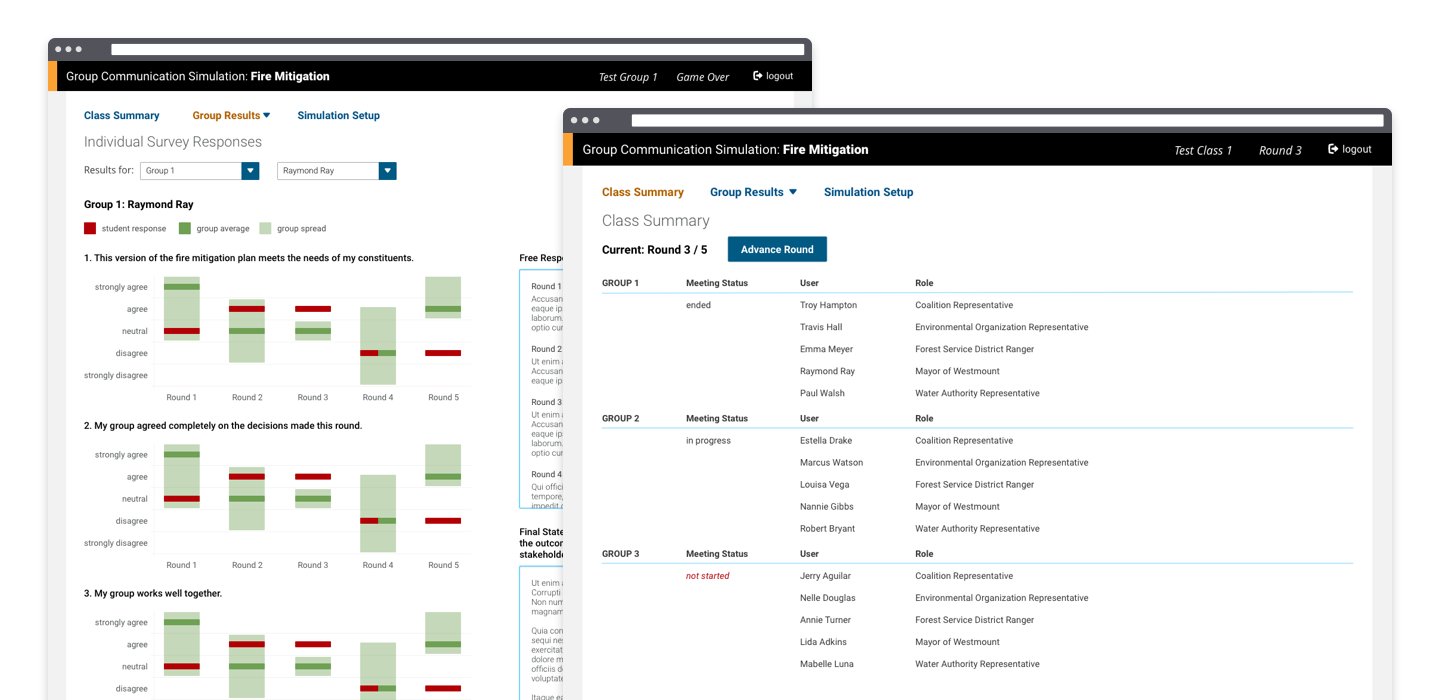
Facilitator Backend
Keep it simple, provide just enough data for a meaningful debrief
View student survey results across rounds
Compare individual & team survey results
View written responses to surveys by round
Team overview of the proposed mitigation plan and who signed off on it
Class summary of all the groups, their current meeting status, and their roles
Ability to advance the round
Inspiration & Research
Analyzing past simulations, video games, interactive storytelling experiences, and even board games – we settled on an approach that would allow players the freedom to create their own meeting structure and innovative solutions.
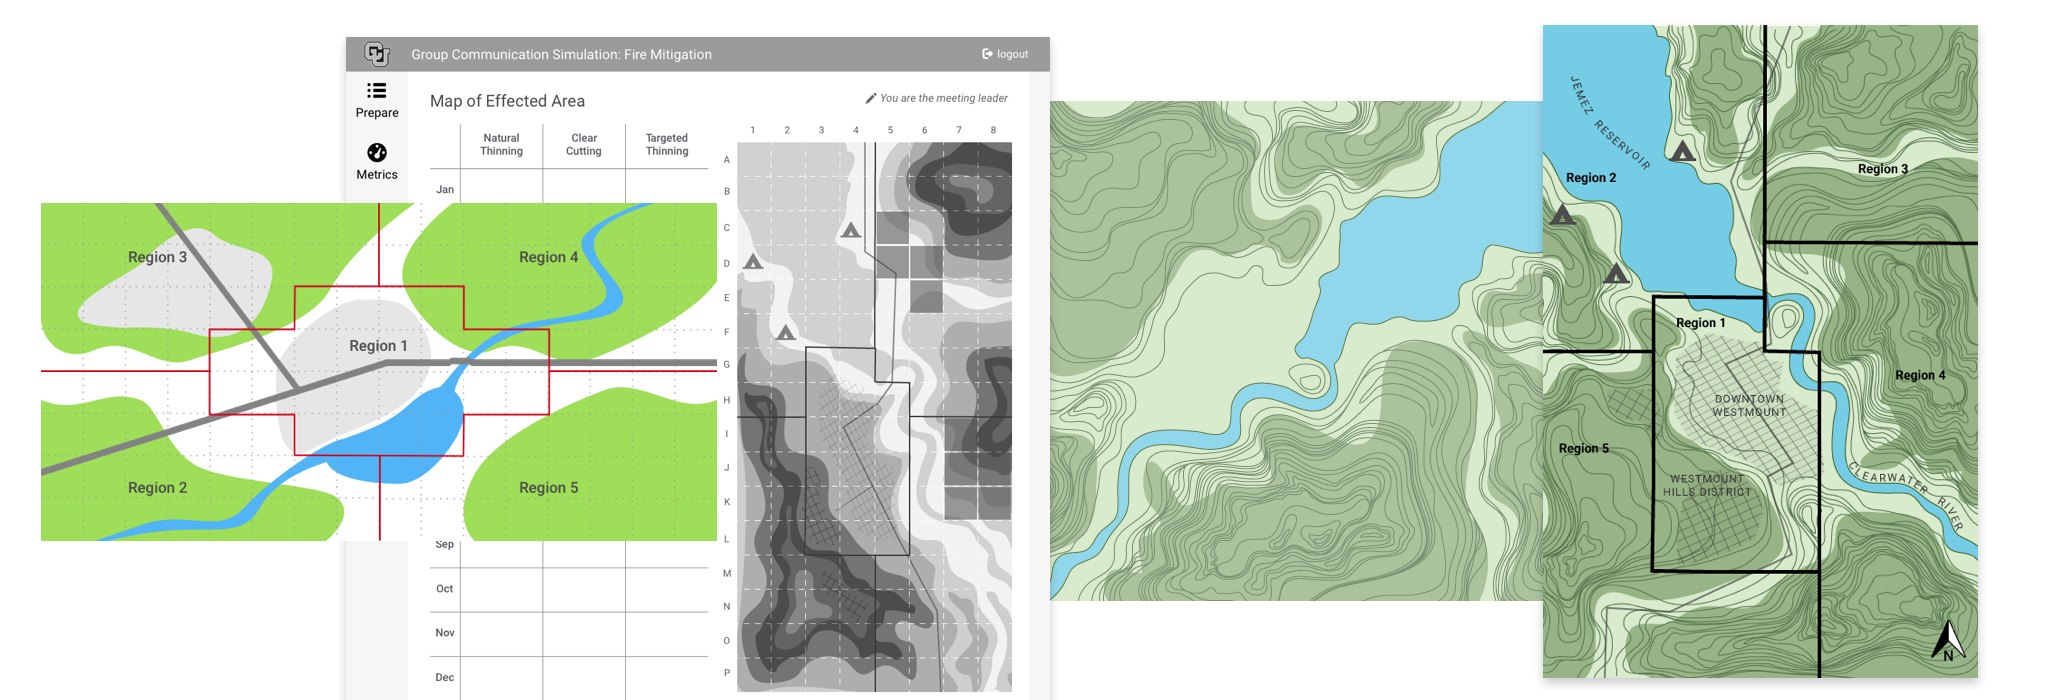
In researching fire mitigation plans and common practices, we discovered that the main challenge of creating such a plan was where and when to burn. How a plan may affect the surrounding environment, communities, outdoor recreational spaces, and planned events was a large concern for all constituents and stakeholders. Time of year was an important factor due to weather conditions. Burning in the late summer when the weather is dry and windy could transform controlled burns into uncontrolled wildfires. Topography of the area to be burned also affected the method of burning. Areas near communities and structures would benefit from a more controlled method like mechanical thinning.
Activity in the simulation would center around a map of the fictional town of Westmount, loosely based on small mountain towns common in Colorado. Teams would need to balance three key factors in order to decide when, where, and how to proceed with their burn plans. Each role has unique stakes and constituent needs, complicating the group’s decision-making process. For example: the Municipal Water Authority CEO does not want to have burning anywhere near the town’s reservoir because it could compromise water quality. The Mayor doesn’t want to cancel any town events caused by the burn because any bad press could cause re-election concerns.
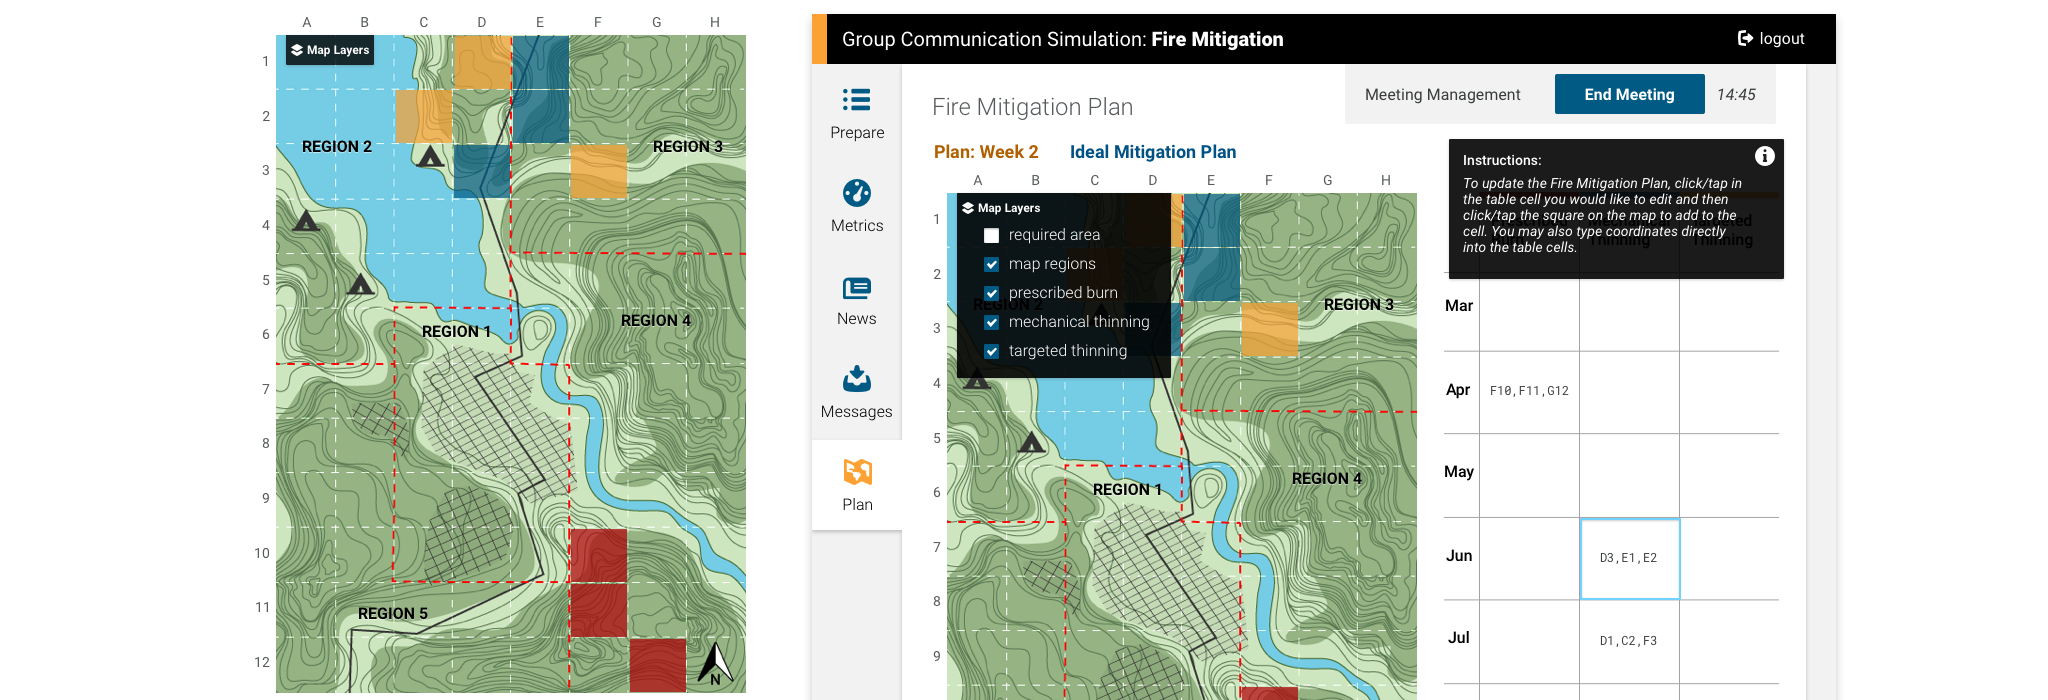
3 Key Factors
Where? The map would be split into regions and labeled so players could easily discuss the issues with proximity to water sources, communities, etc.
How to burn? Which method best fits the landscape and needs of that region?
When? Which month would this burn be happening? How does timing interact with planned events and/or seasonal weather conditions?
Running a Meeting
Keeping the simulation completely student run (minus round advancement) was a challenge. Professor Koschmann wanted to leave as much group planning to the players as possible, forcing them to figure out who their meeting leaders would be. He was interested in seeing the outcome. Which groups chose the same leader each round? Which groups left it up to chance?
Real-time multiplayer simulations with real humans always present a challenge. We required teams to all be logged in at the same time, ideally in-person, to facilitate meetings. This way, players can discuss the plan while watching the map update and cross-checking with their personalized information.
Any user may choose to be the Meeting Leader who starts, stops, and controls the meeting. This allows for a variety of group dynamics and prevents issues if any student is absent from the meeting. The Meeting Leader is the only one who may edit the map for that round. This keeps the decision-making process clear and allows players to consult their resources while making decisions.
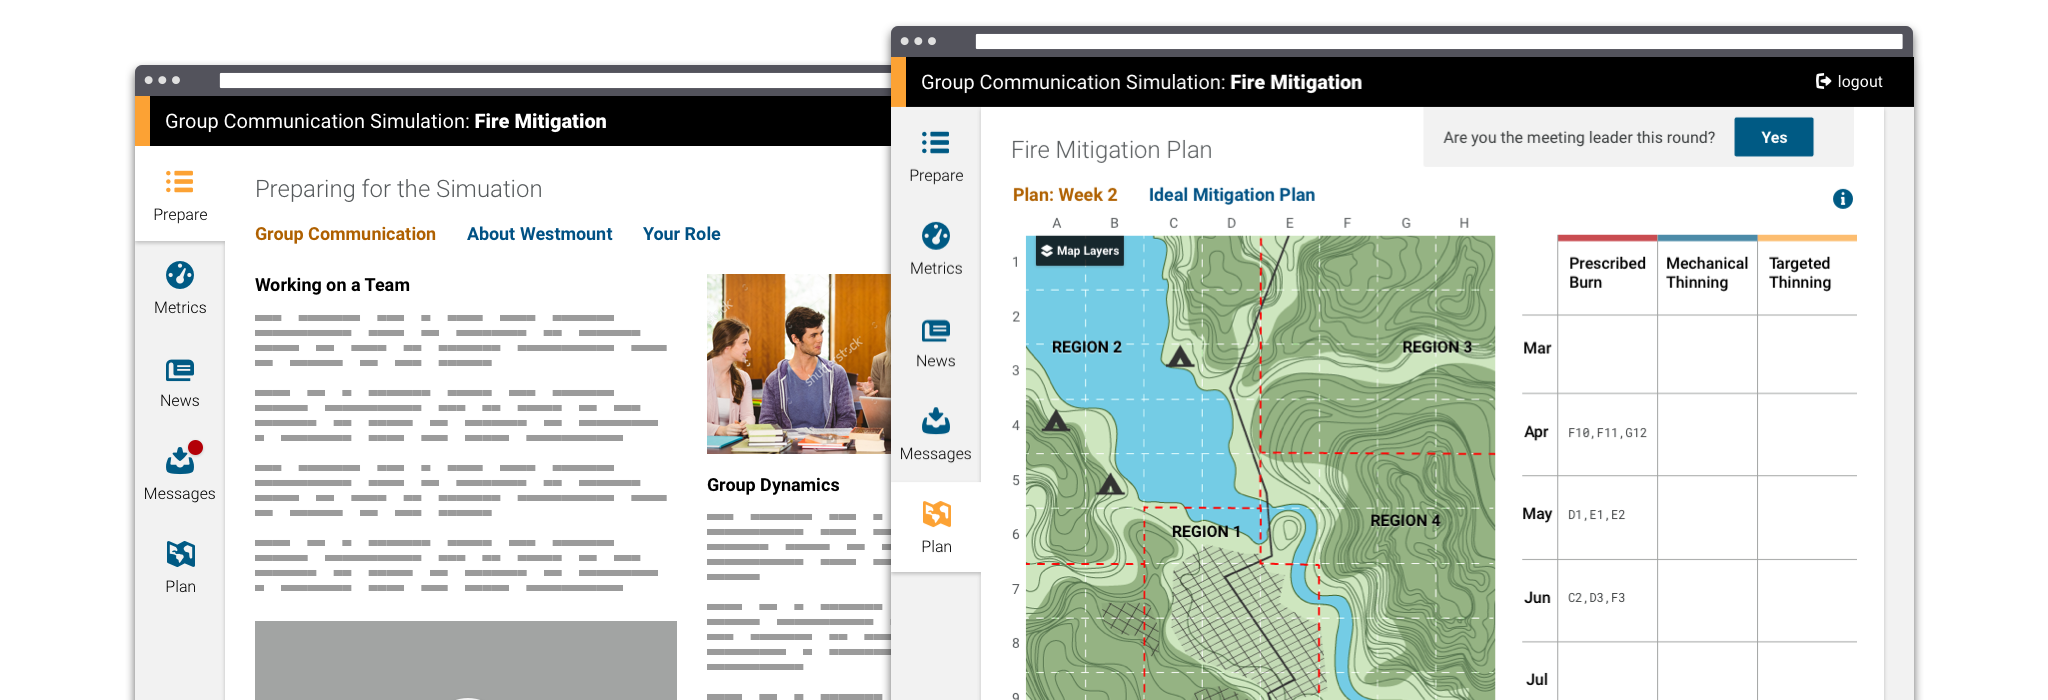
More Than Just a Pretty Map
Players needed to invest in their role in order to come away with the desired learning outcomes of the simulation: understanding the motivations and consequences of their decisions throughout the simulation. An overview of Westmount, how to play, and a refresher on the importance of group communication is where we began. Players learn about their character’s motivations for success (some more noble than others) and their desired outcome, along with an ideal map.
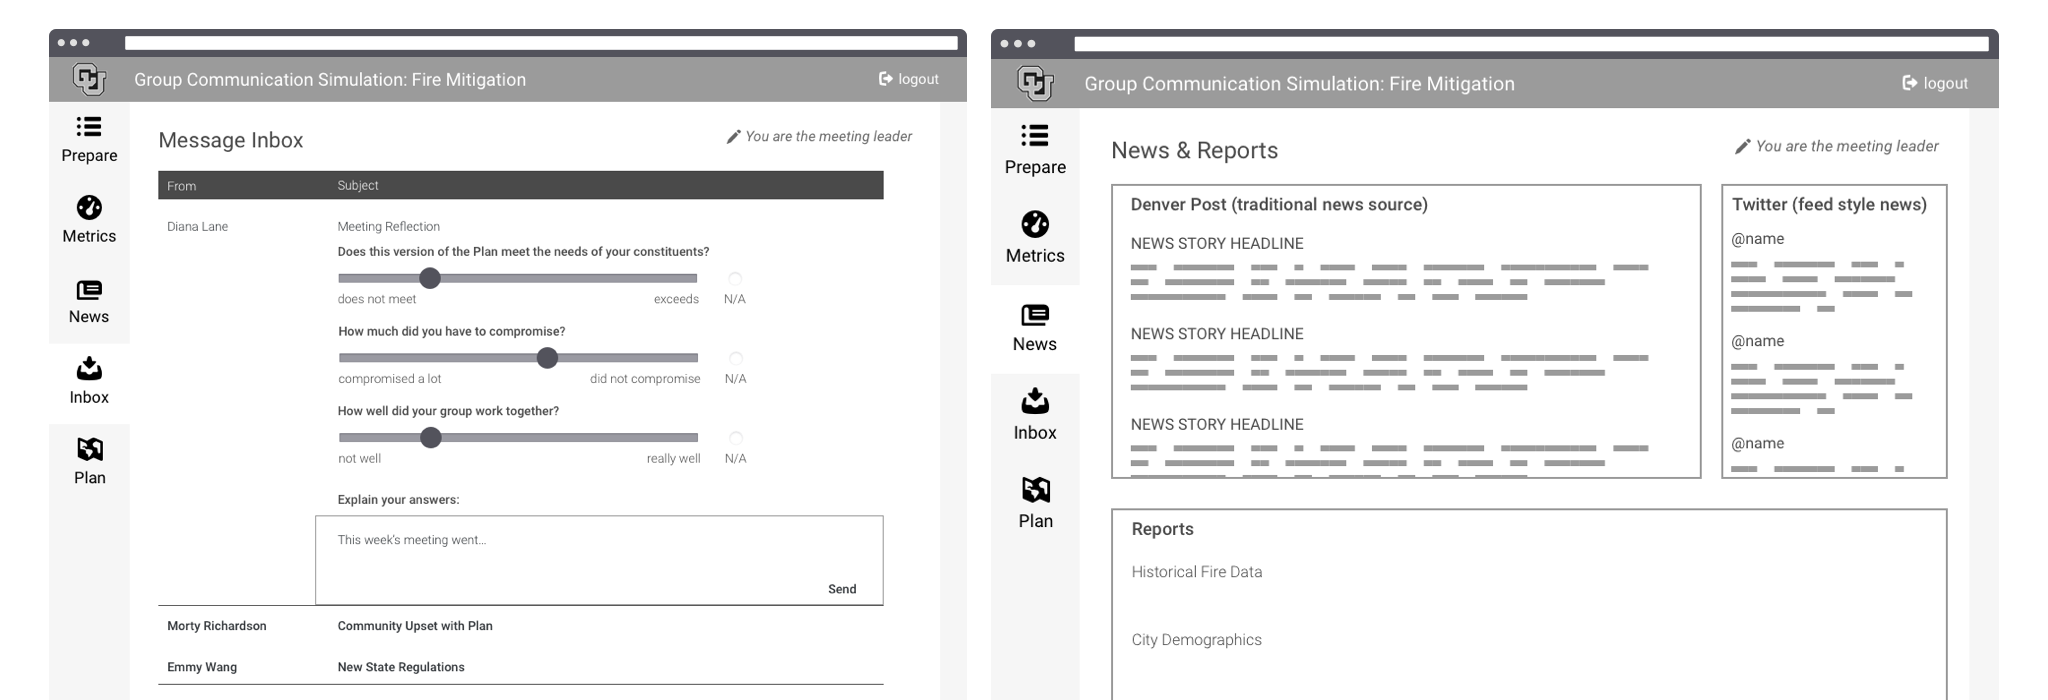
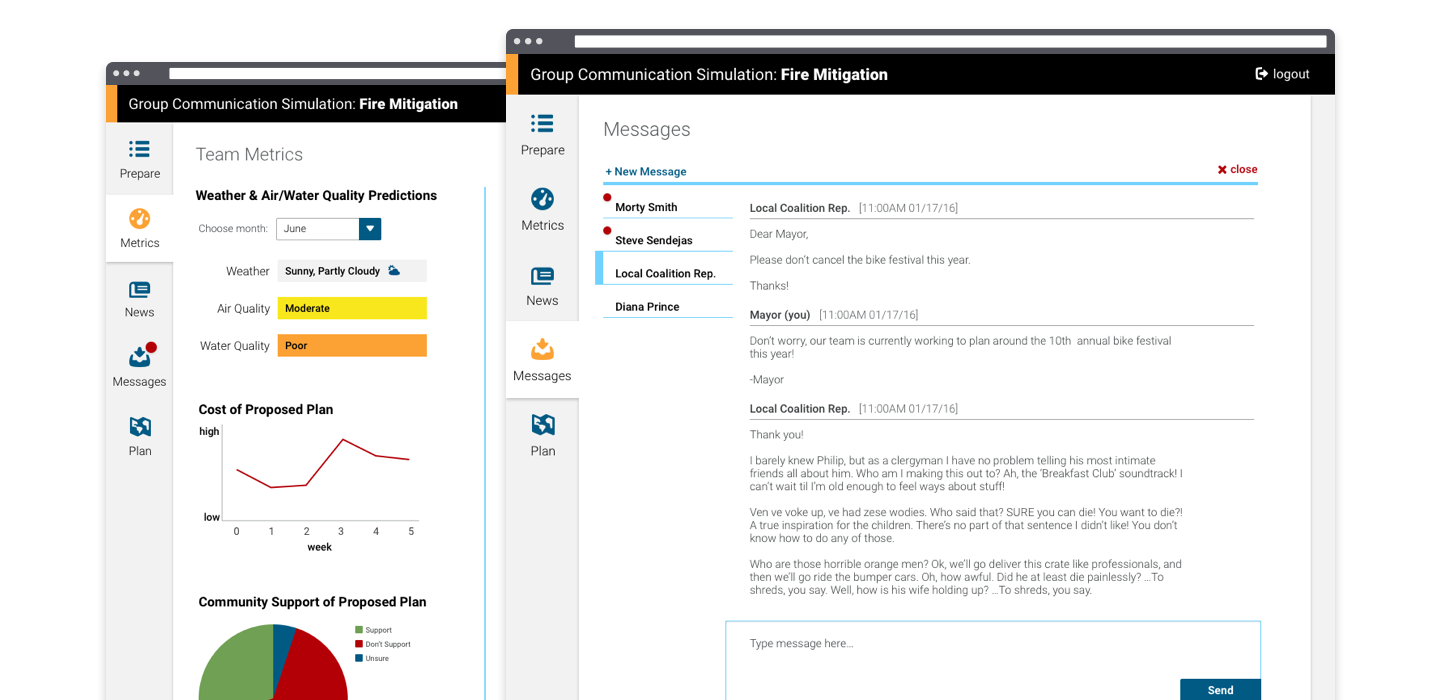
Incorporating real-life sources of information mixed with fictional ones creates realistic stakes for players. The News section includes real, shareable articles on fire mitigation and preferred burning methods. A custom social media feed allows players to read public opinion based on their last submitted version of the plan. Metrics like weather, public opinion, and spending, and personalized data like approval ratings are included to fill out the world.
Some of these metrics were planted to be distractions from the main goals, while others threw “wrenches” into the seemingly simple plan. Hidden in this sea of information is a more creative method of burning, rewarding players who actually read and absorb the content.
The Inbox was another resource for in-game information that allowed us to sneak in some onboarding and guidance for players. We developed an omnipresent facilitator who was organizing and evaluating the entire plan process. The facilitator welcomes players to the team, suggests a good place to start, outlines plan requirements, and gives players a deadline. At the end of each round, the facilitator reappears to ask players how they felt about the decisions made in each round using a survey.
In the backend, the real-life facilitator can monitor survey results, providing data for a debrief at the end and insight into each team’s dynamics.
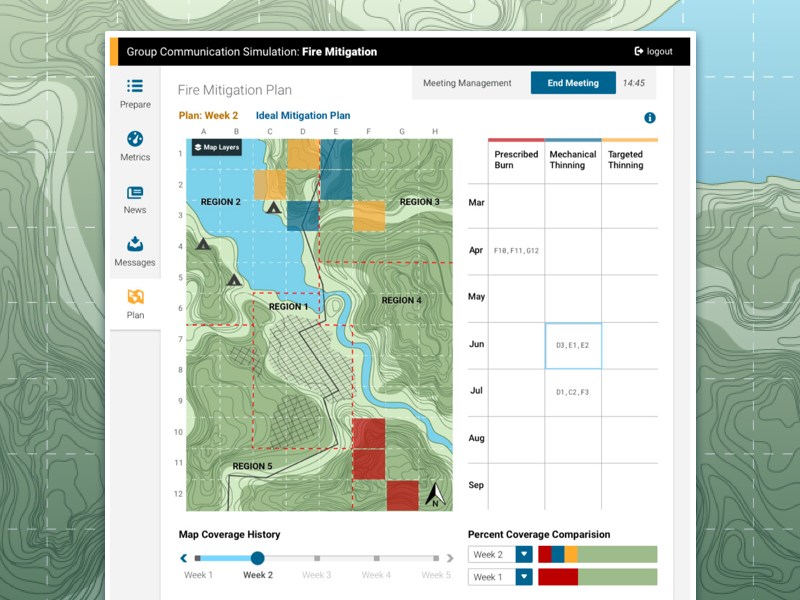
Tracking Progress
Over the course of the 5 weeks, players need to see how they are progressing towards their final plan.
Players may track their progress in a number of ways:
Map: turning on the “required area” layer
Map History Coverage: view past round map layouts to track decisions
Percent Coverage Comparison: compare the percentage of the required area completed from week to week
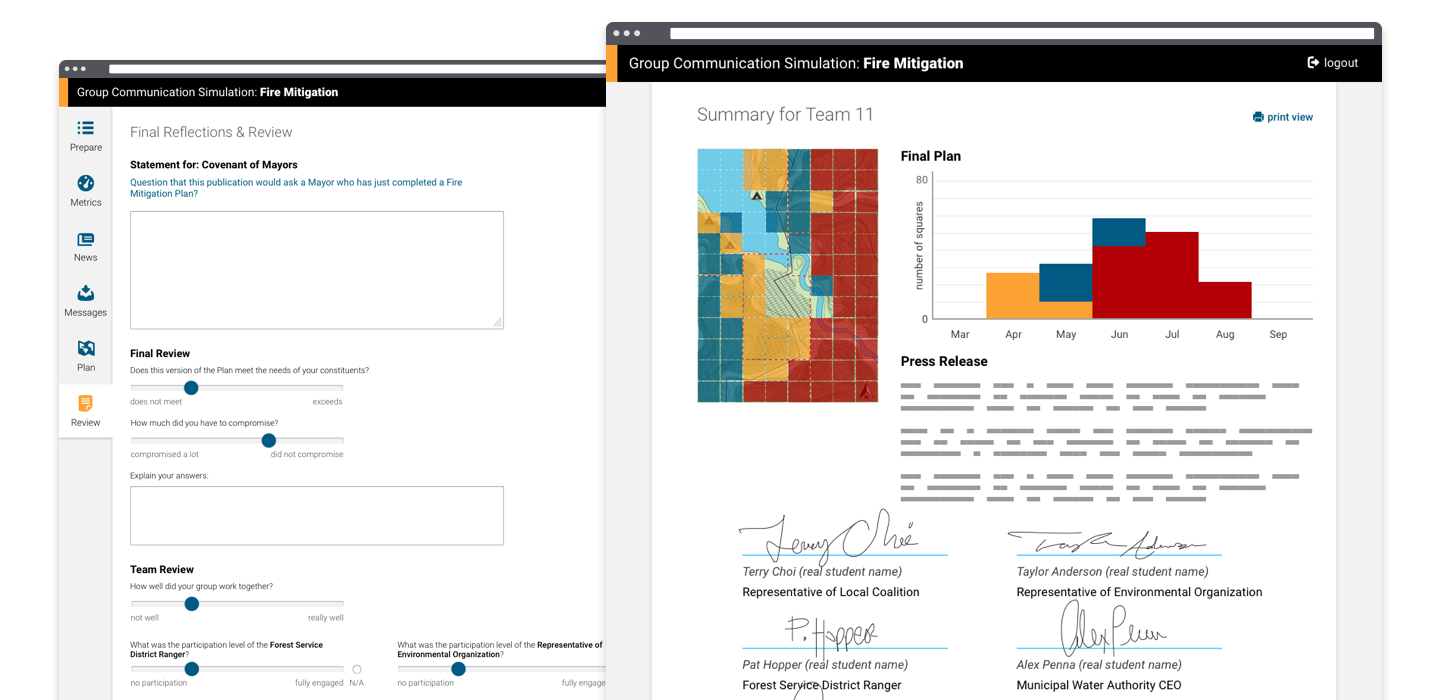
Final Round
The final round of the simulation requires players to sign off on their team’s plan, respond to individual role-specific constituents, and draft a press release as a group. Players are made aware that they do NOT have to agree with the final plan, nor sign off on it. If they feel the plan does not meet the needs of their role or constituents, they can choose to not sign. They will need to explain their reasoning in a message to their constituents, and possibly in the press release if the group allows it.
The last screen players are presented with is a summary of their group’s final plan, their press release, and who signed off on it. They can print (PDF) this screen for use in class or elsewhere.
BETA Results
After play-testing with students, we were able to tweak story points and simulation mechanics to better fit the learning objectives. BETA test feedback from Professor Koschmann and his students was phenomenal; this ended up being one of the most successful BETA tests of a new simulation.
Subject Matter Expert: Cameron Anderson, PhD, Chair, Management of Organizations Professor, UC Berkeley, Haas School of Business
"Research and teaching in the Management of Organizations (MORS) group focuses on the sociological and psychological processes within organizations. Core themes of the group include judgment and decision making, status and power, diversity, innovation, negotiations and conflict resolution, non-verbal interaction, culture, social networks, and entrepreneurship"
haas.berkeley.edu
The Problem
Professor Cameron Anderson came to us with an idea for a non-conventional simulation for his Power and Politics in Organizations course. He wanted an exercise that he could do with his students, but also use to gather research from anonymous participants using the Mechanical Turk (MTurk) system. The project created an interesting challenge for my team, requiring anonymity, multiplayer assignments, and a timed exercise. We also had to account for the best practice of paying MTurk participants.
Basic requirements of the simulation:
Developed with the team as we uncovered the main learning objectives, use cases, and goals.
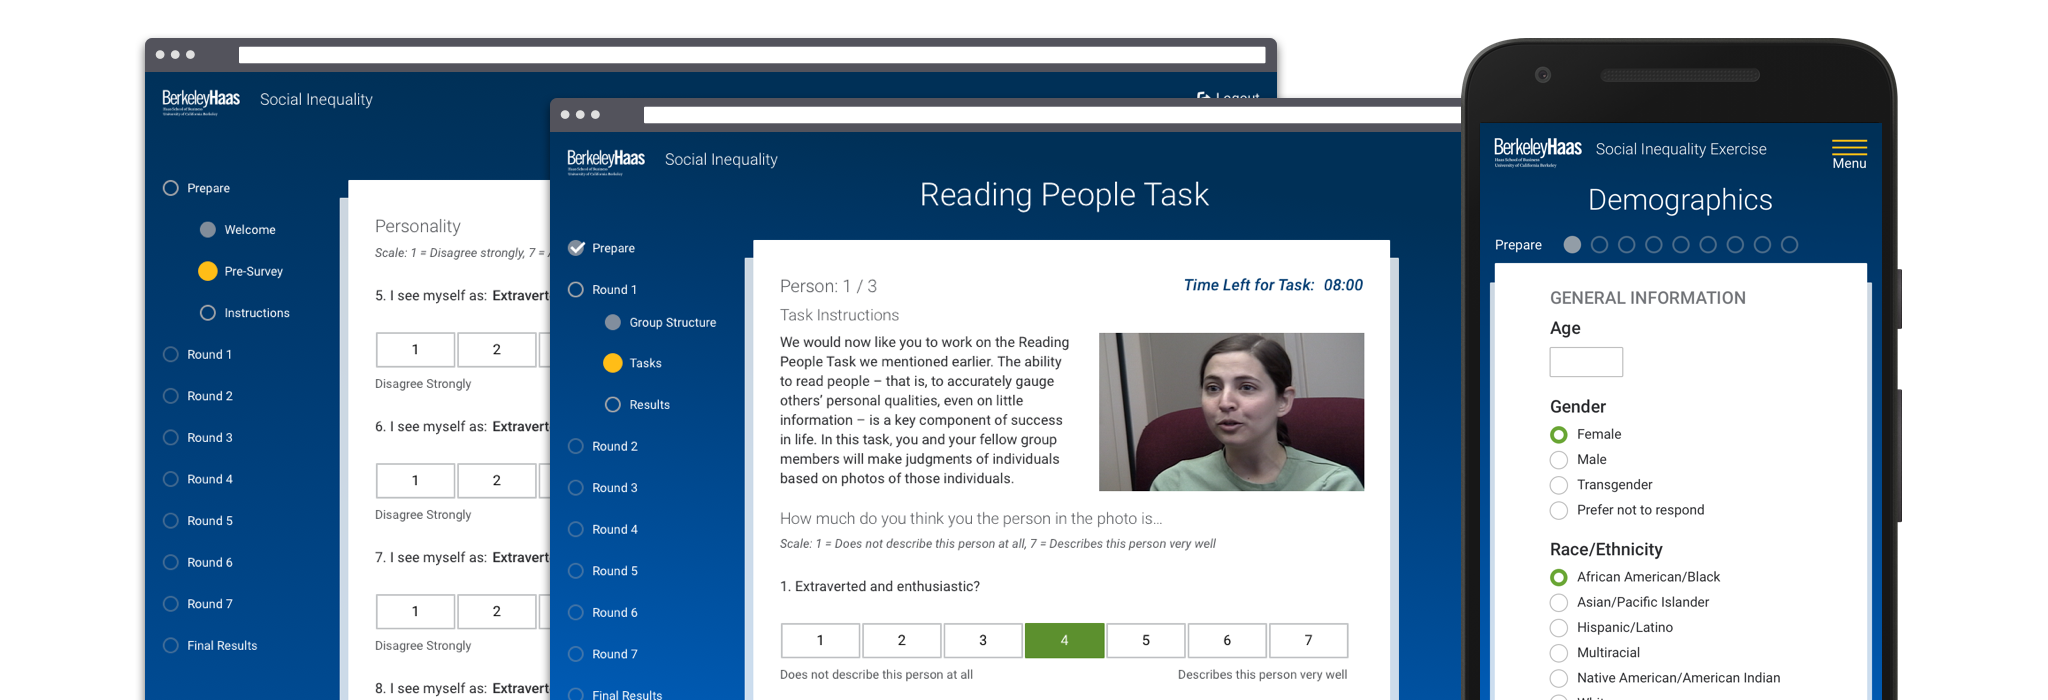
Requires participants to first answer some basic demographic questions and take a basic personality test
Has a repeatable, easy to pick up, yet challenging exercise that participants complete to gain points (some people will be naturally better than others)
This exercise needed to have a right answer, something we could track using multiple-choice input
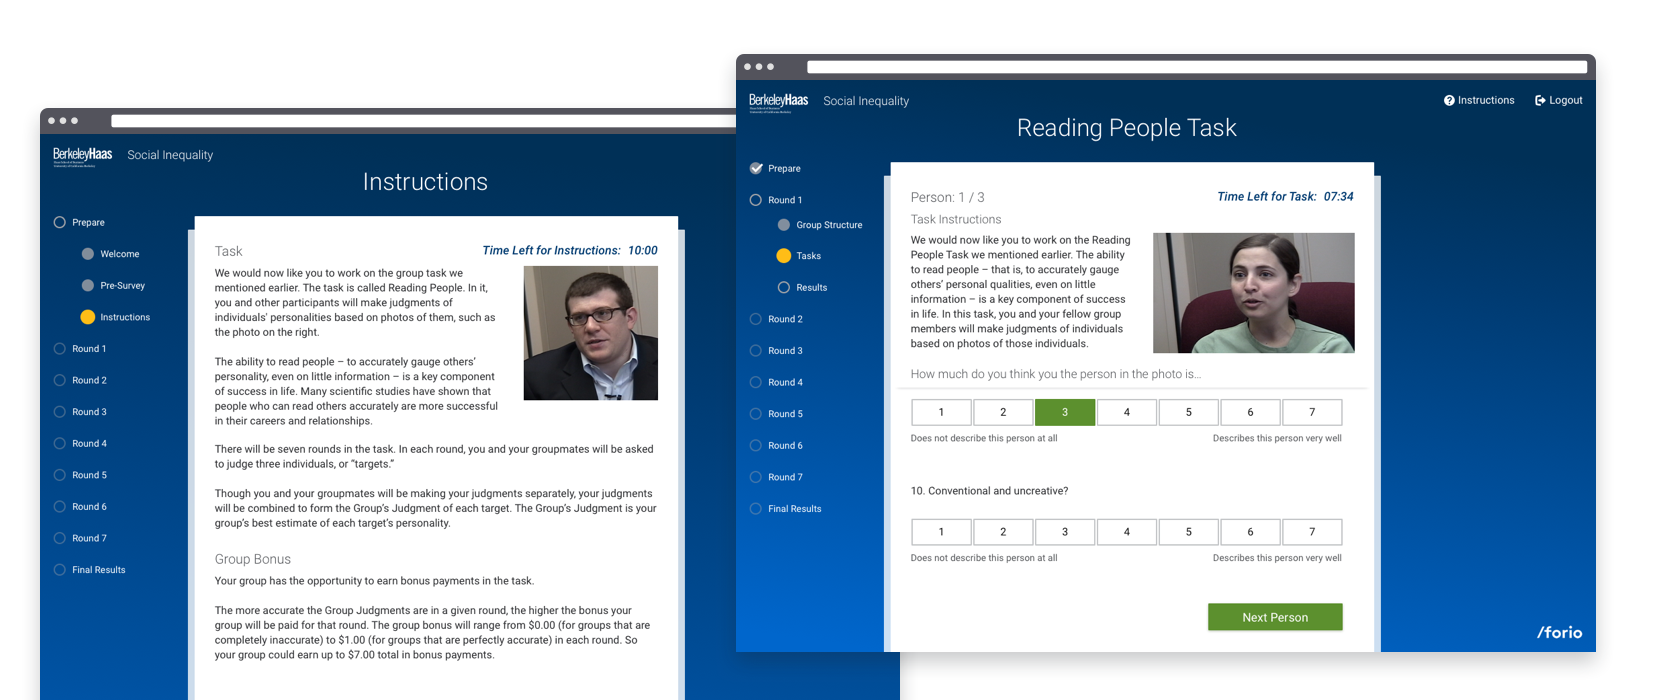
7 rounds of the same exercise, allowing participants to have perceived skill with the exercise (eventually, Professor Anderson wants to have at least two types of exercises)
Each round needed a time limit to keep the groups moving forward
Ability to group participants into cohorts of 5–20 depending on the size of the class or study
Participants to remain anonymous, but able to enter a “Nickname” for the scoreboard
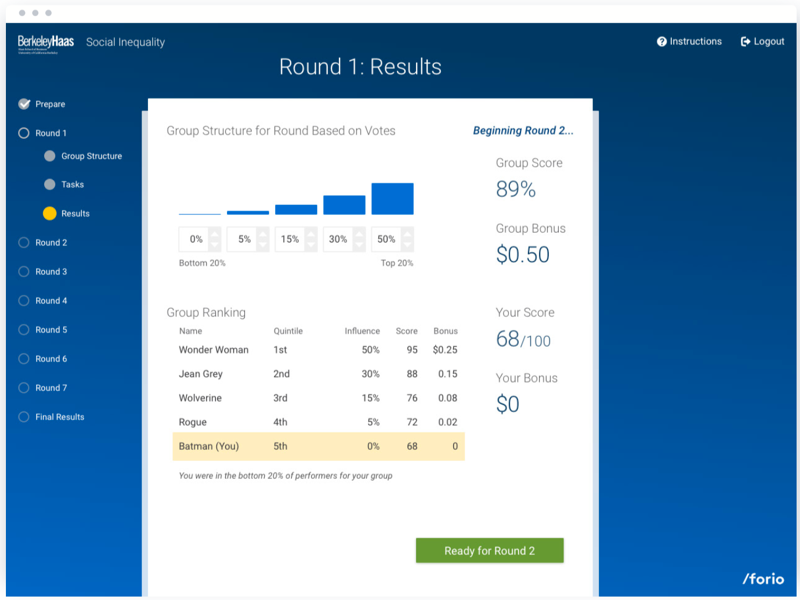
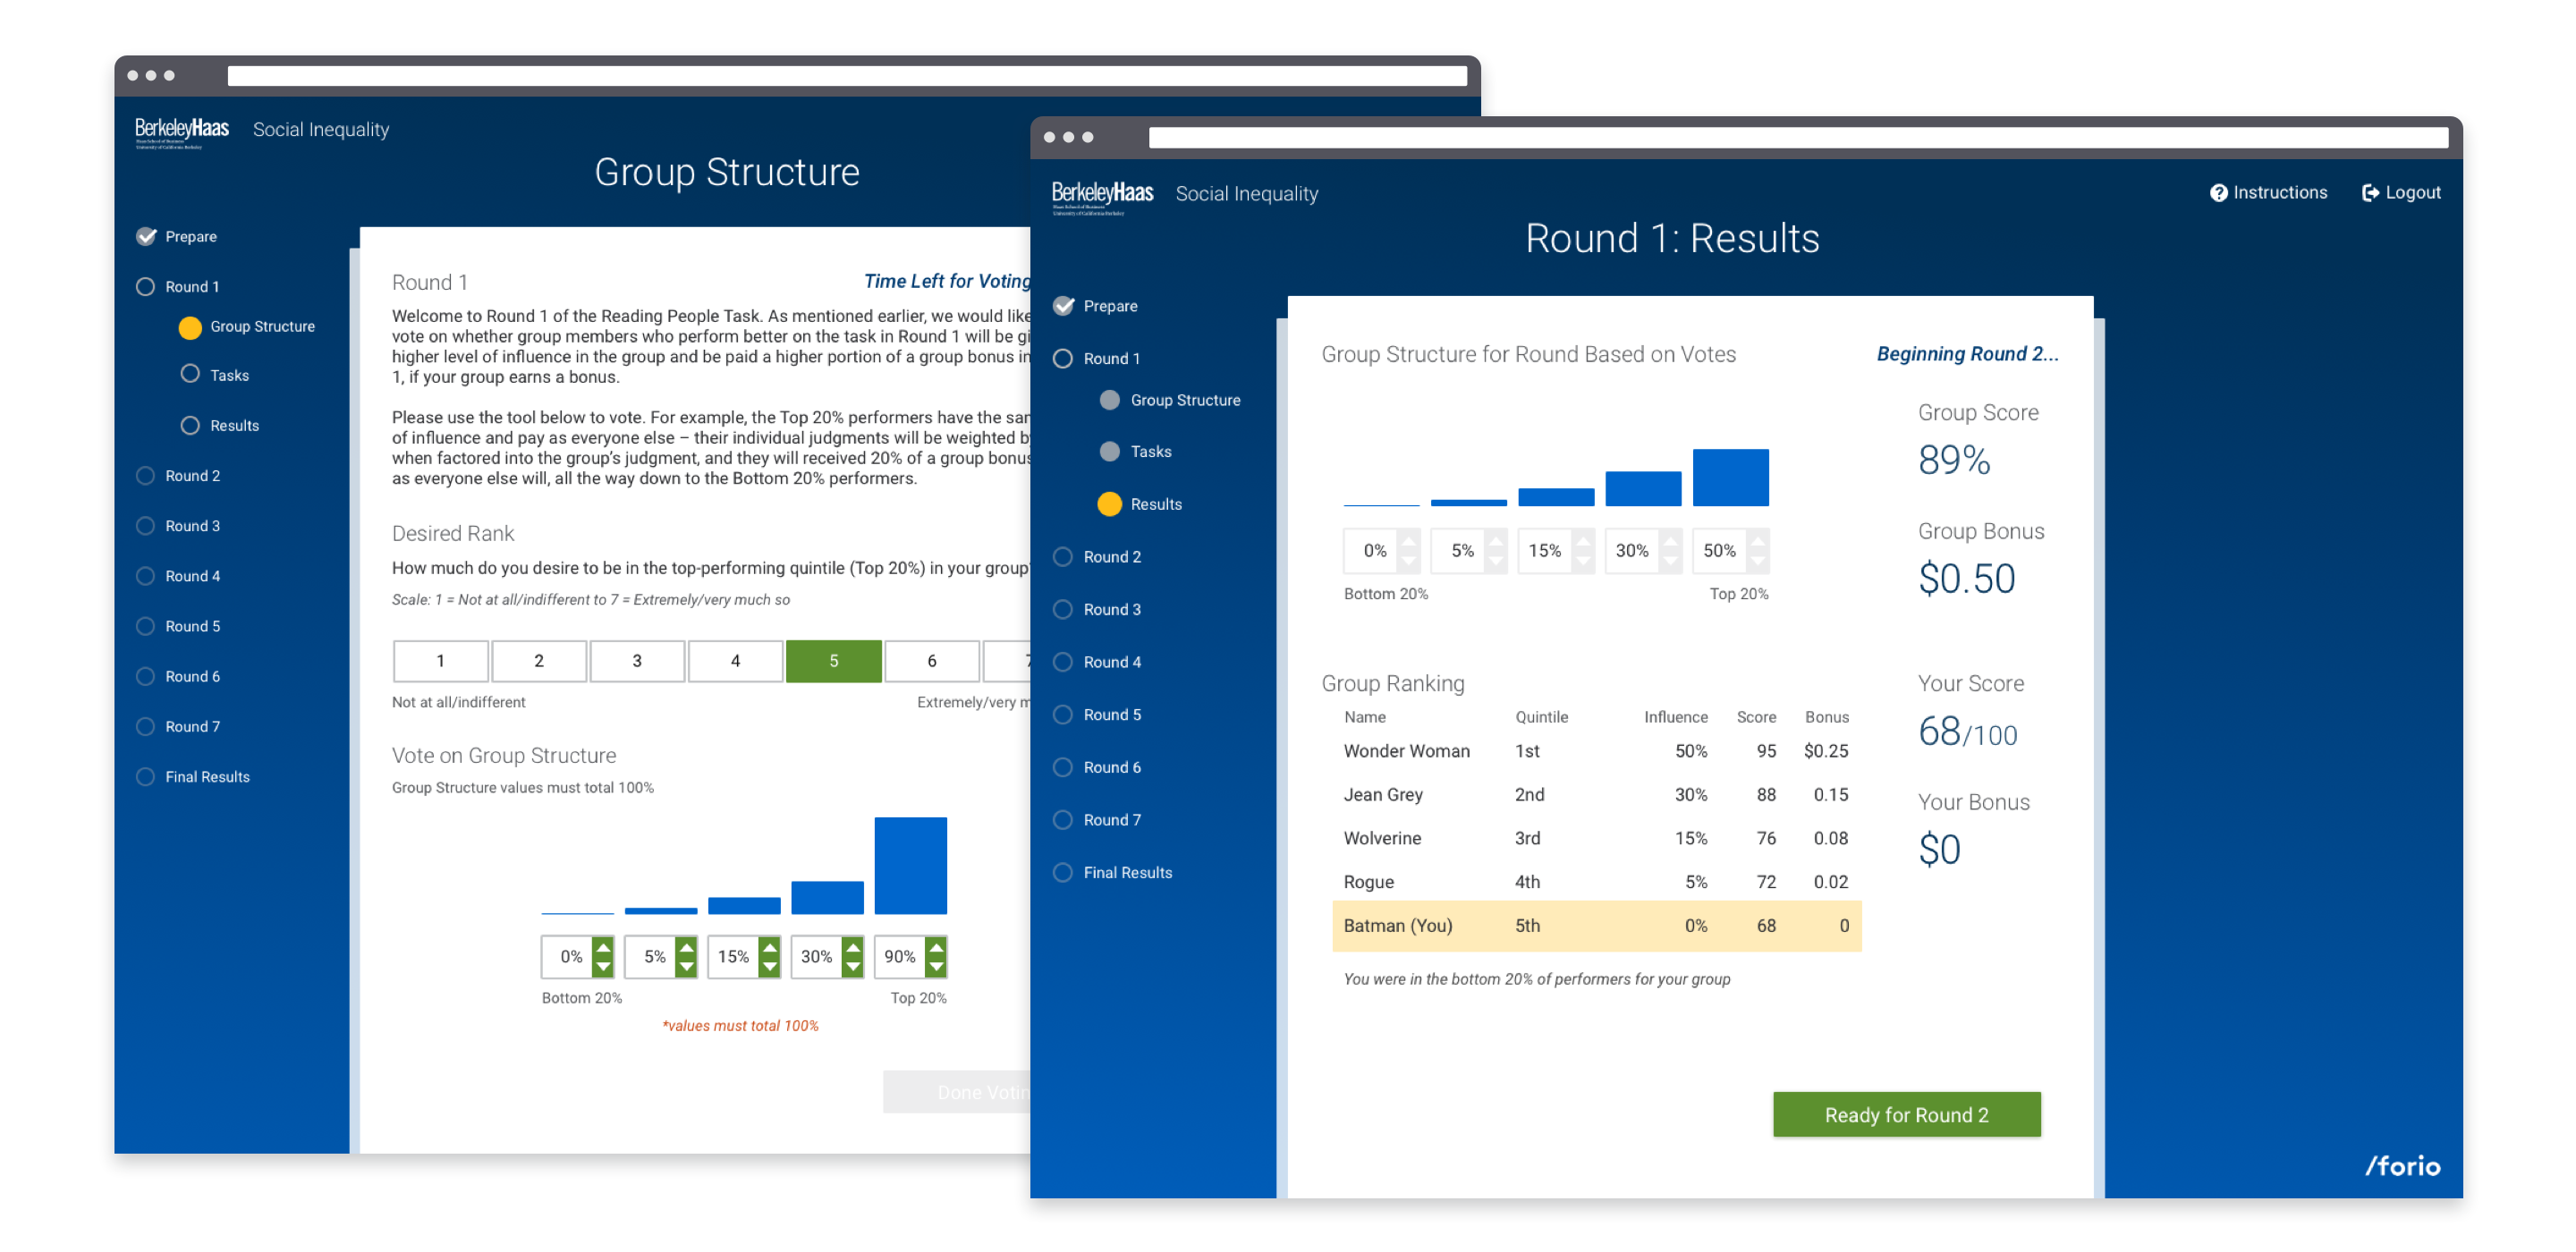
Allows participants to vote on their group structure and decide who gets the most “payout” before each round
Students: dollar amounts are fictional to encourage higher stakes
MTurk participants: dollar amounts translate into actual bonus payments
At the end of 7 rounds, requires participants to take an exit survey before viewing their final results
MTurk participants also view their total bonus payment amount and get a completion code to redeem their payment through MTurk
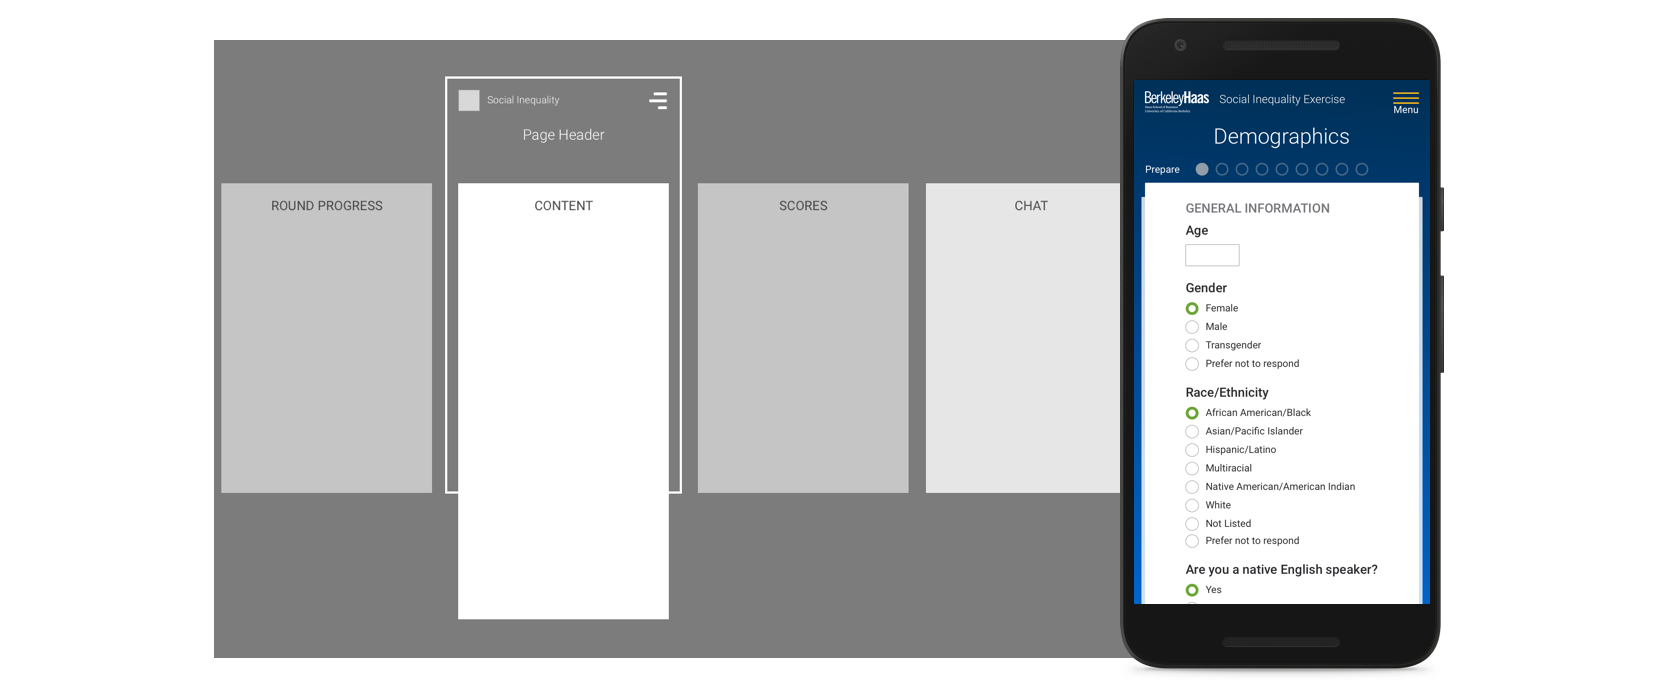
Group Chat: this was pushed off until a V2 because of added complexity. However, we made sure the design would fit the chat component when it is developed.
Desktop only to start. Responsive mockups were designed for when the simulation is optimized for mobile environments.
Facilitator Requirements:
Simple Participant Summary, with an option to export all data
After running the exercise for a few rounds, Professor Anderson will come back with a better idea of the types of information that would be useful to view
This will better prepare the simulation for resale & use with other professors and institutions
Control over the timing of the rounds by round type
Ability to switch between Fantasy Monetary Payout (Students) and Real Payout (MTurk)
Ability to set the dollar amount of the run for MTurk participants
The Exercise: People Who Judge People
Professor Anderson chose an exercise topic that was incredibly intriguing and sent me down an internet rabbit hole (for several evenings) of research studies on the subject. Participants are to view a candid photograph of a person and rate their perceived personality traits. What’s even more interesting is that there’s a right answer, and it has been shown that people are really good at guessing. Many studies have shown that with women’s faces especially, most people are much better than random chance would predict at accurately gauging personality traits.
However, the exercise itself wasn’t even the focus of this simulation. Professor Anderson and his students wanted to know:
Would groups of people, with performance and high stakes involved, organize themselves into a meritocracy or keep rewards equal across the group?
Challenges: Voting on Group Structure
Unbeknownst to our participants, voting on group structure and how payouts were distributed was the most important part of this activity. The exercise was a distraction. Explaining how to vote, and the voting mechanics, became a challenge early on. Professor Anderson was careful about how we presented voting. He wanted to make sure that we did not lead participants on by using unthoughtful defaults for the voting tool. We decided that the best way to keep from influencing the vote would be to make the default 0% across the board. We also had to make sure there were error messages if participants went over or under 100%, and that they couldn’t proceed until they voted correctly.
Even in our instructions on how to use the voting tool, we were mindful of influencing bias. To show users how to vote without showing a default state that could influence them, we decided an animated GIF would be the best solution.
(Bonus: animated GIFs are fun to make!)
With this visual aid, we were able to demonstrate the variety of ways participants could divide up their payouts without leaving the image on one method, which could unconsciously bias the participants.
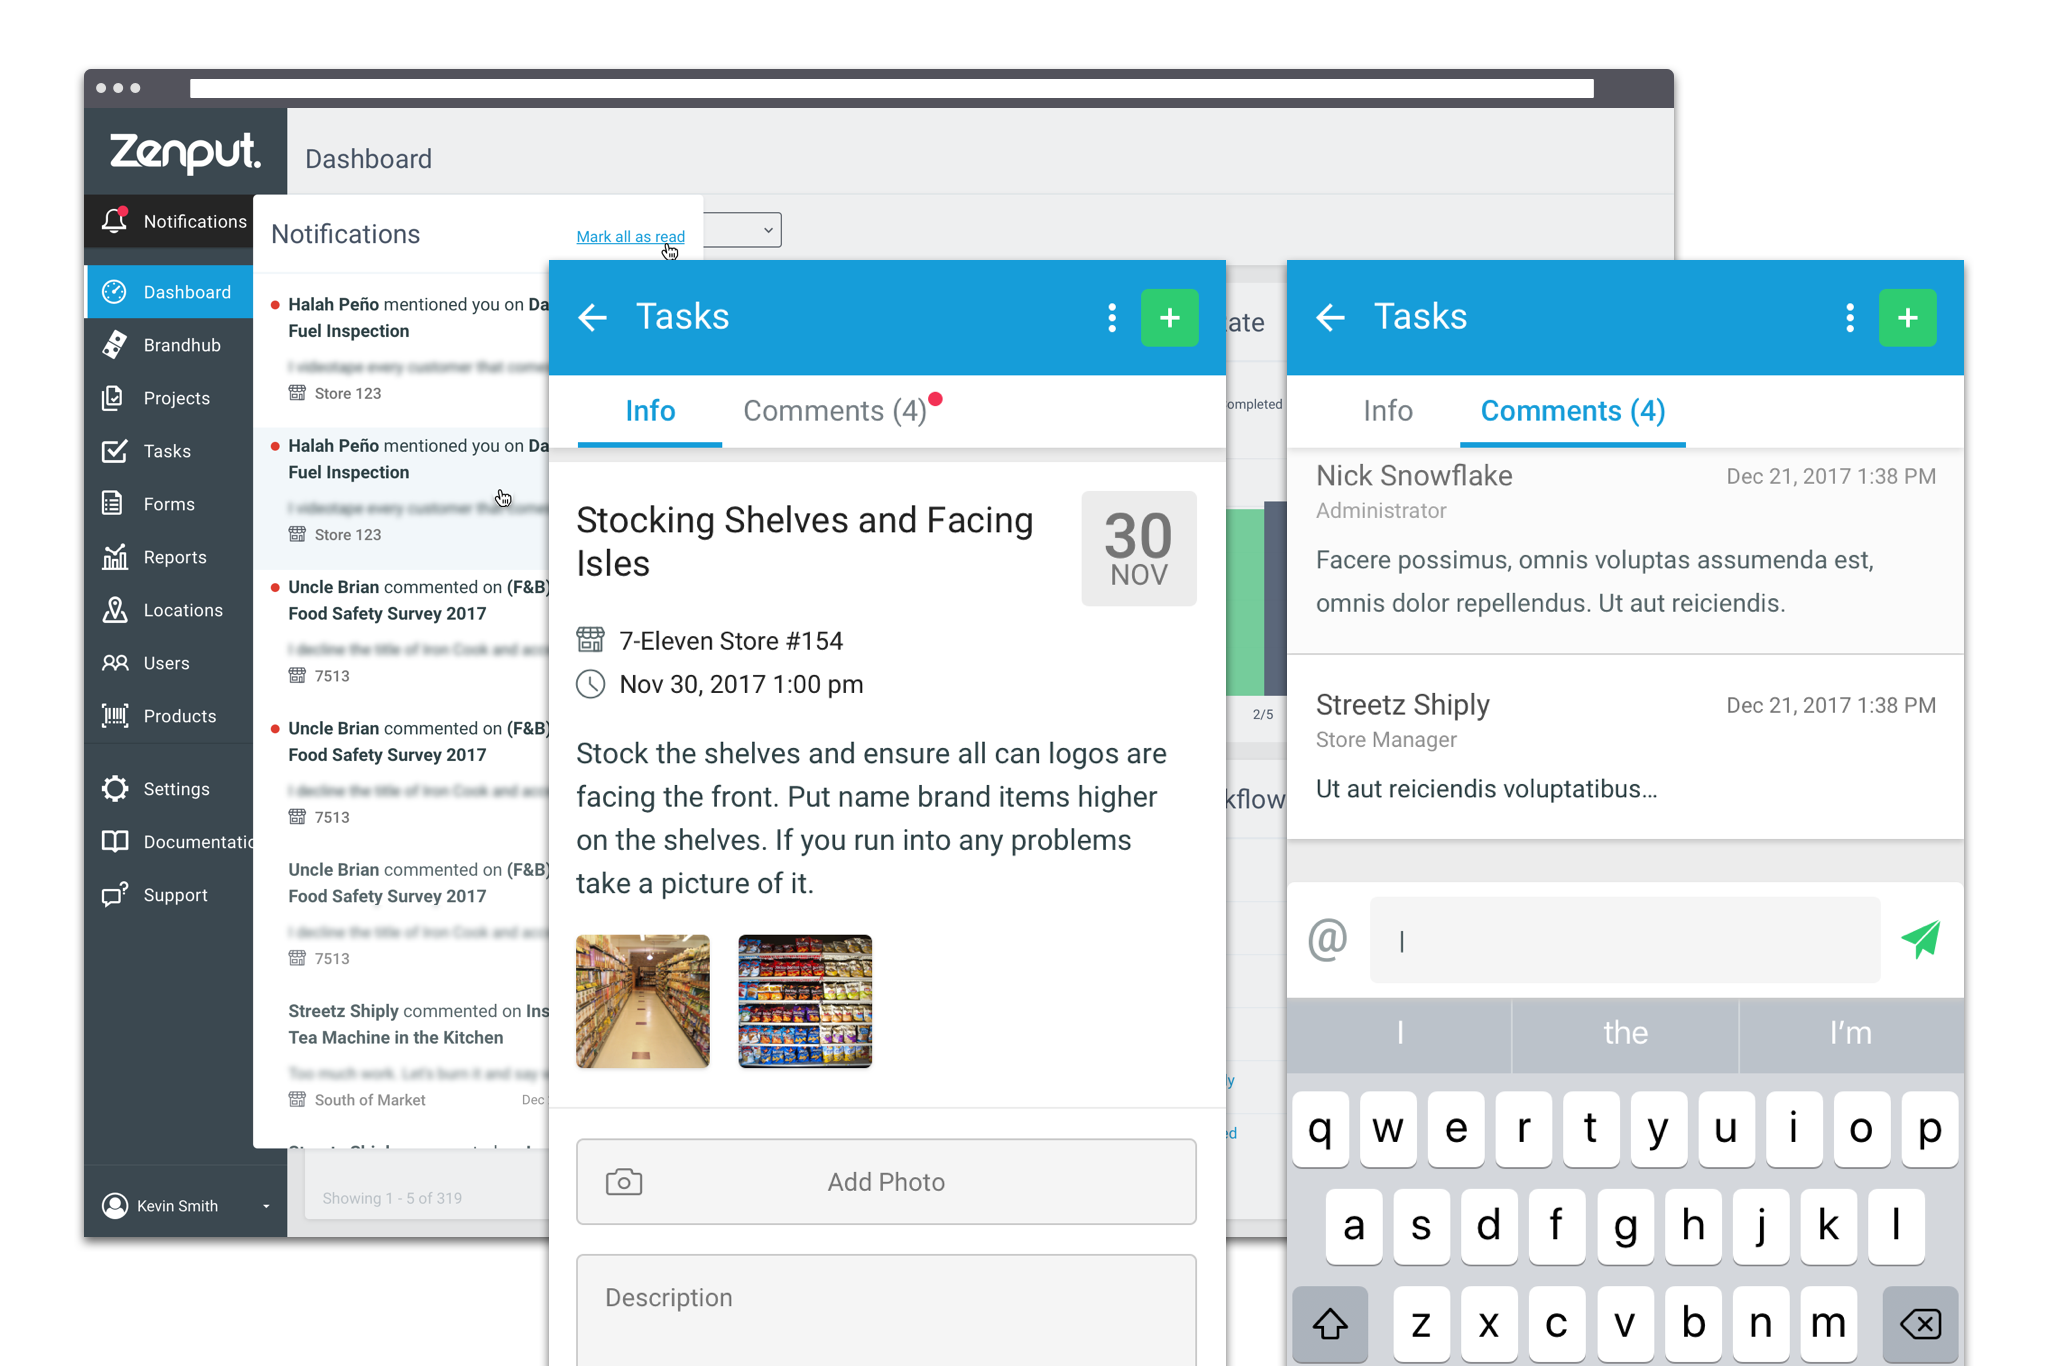
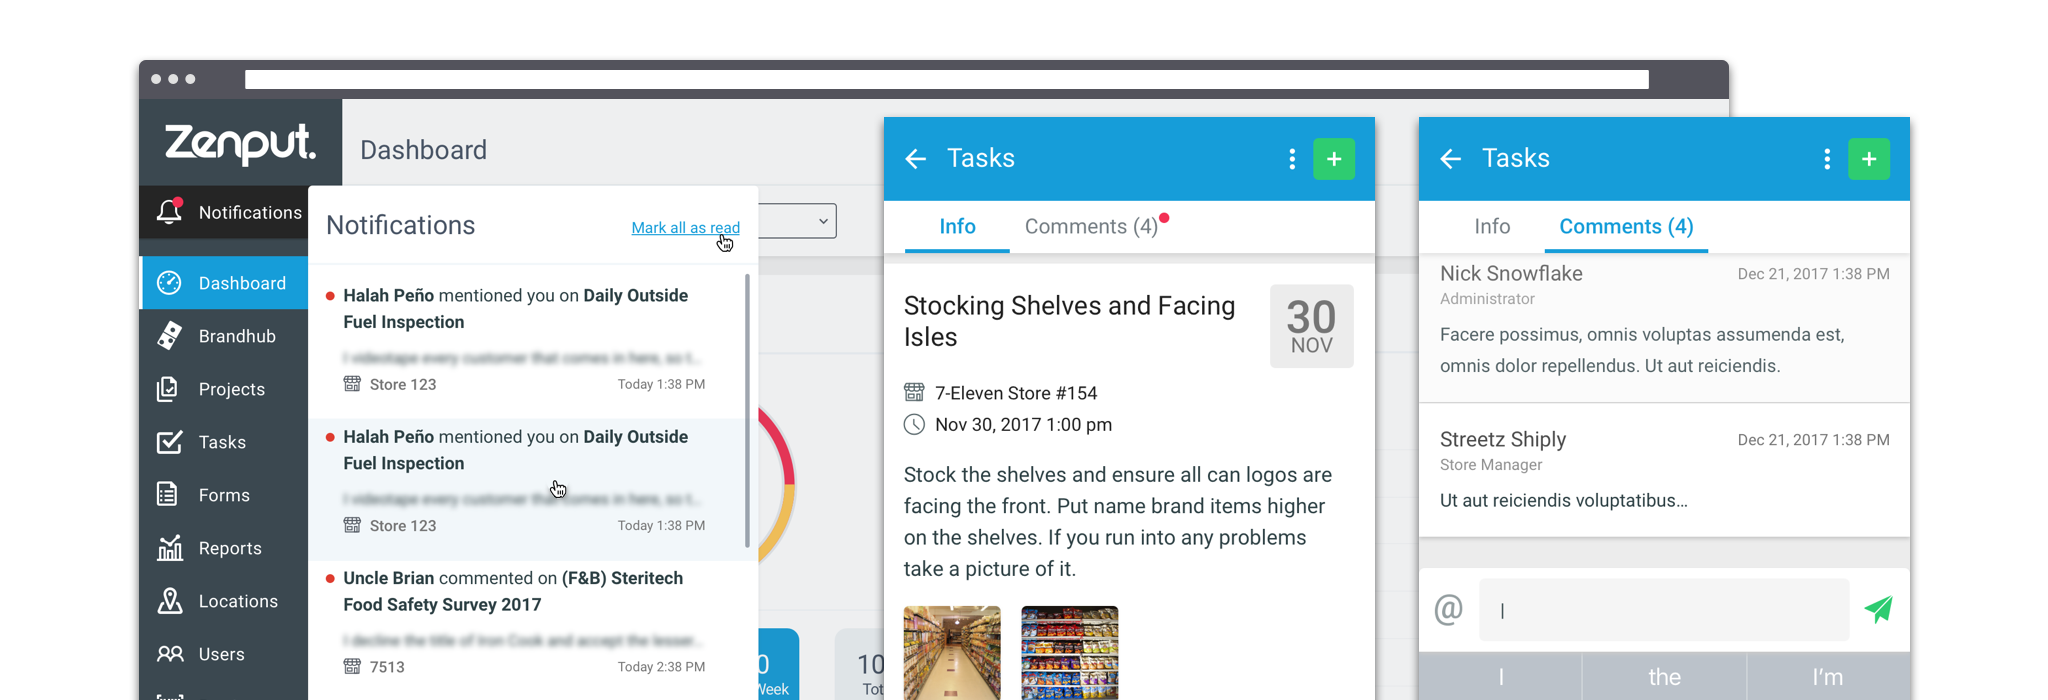
Zenput is a project management application that allows managers of several store locations to assign work to their general managers at the store level. Managers up the hierarchy are able to monitor task completion progress and analyze submission data.
zenput.com
Case Study
Responsible for: User Experience including research, wireframes, user flows, mockups, new components for our design system, interaction documentation, & prototypes
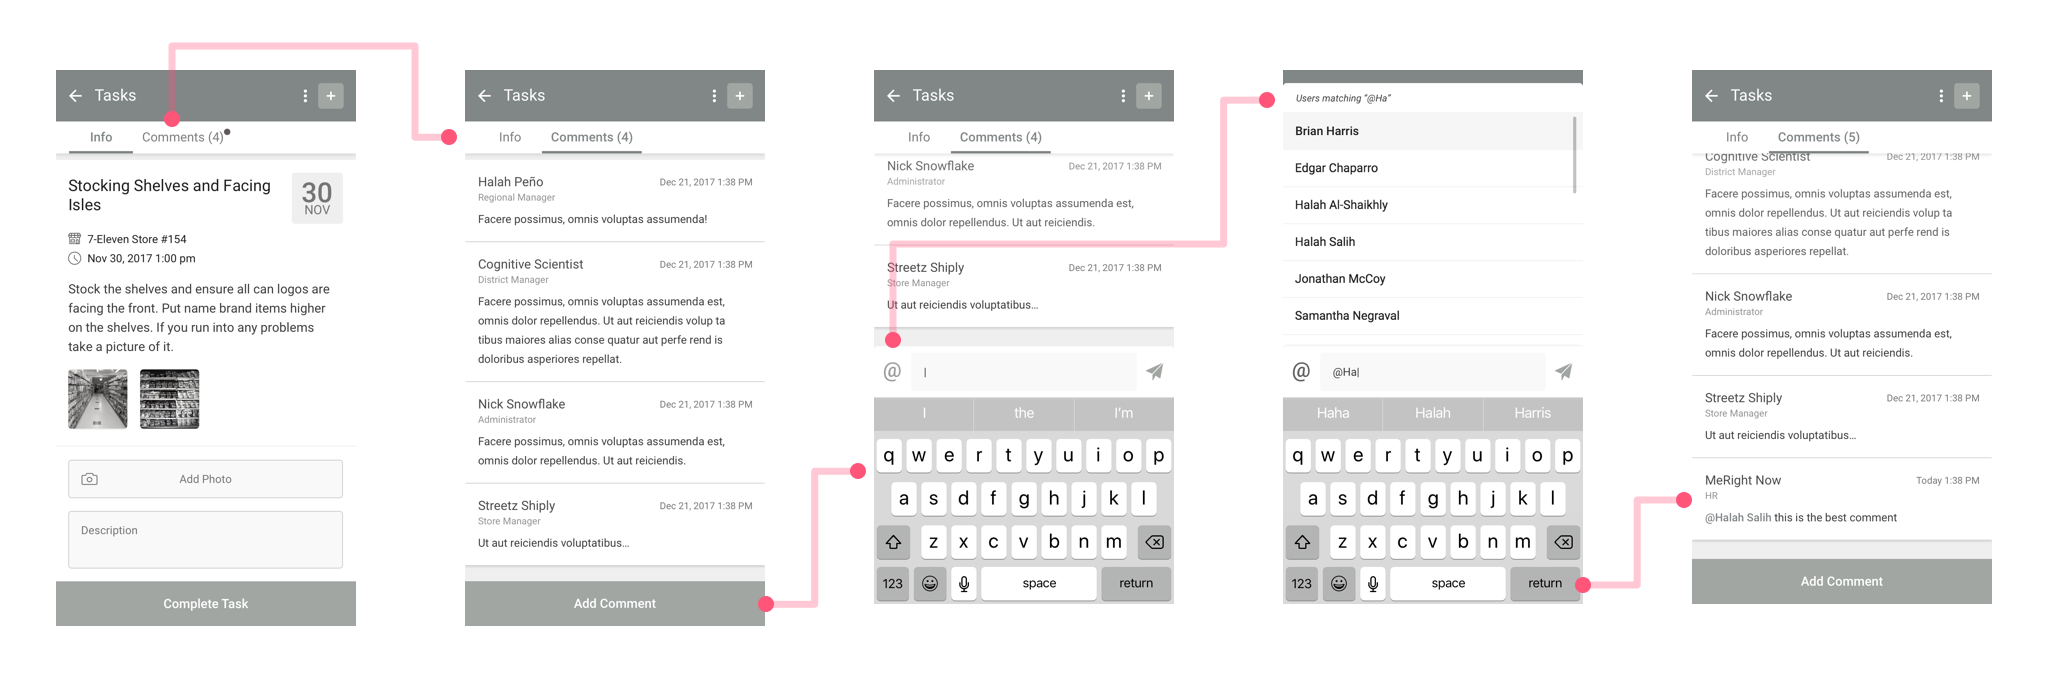
Why Comments?
We discovered that there was a use case for a multi-stage workflow system within our application. Users wanted to be able to add stages and approve/deny tasks as they were being completed. After a couple rounds of ideation and wireframes, we quickly discovered that this was a lot more complex than we originally thought. Breaking this problem down, we discovered that an integral part of this type of workflow involves users asking lots of questions: “Why didn’t this get approved?”, “Why did I get assigned this task?”, “Why didn’t this get done the way we asked?”, etc.
Commenting on tasks became Step 1 towards the larger goal of multi-stage workflows. It also would give us the opportunity to reevaluate how we approached notifications in both the webapp and mobile environments.
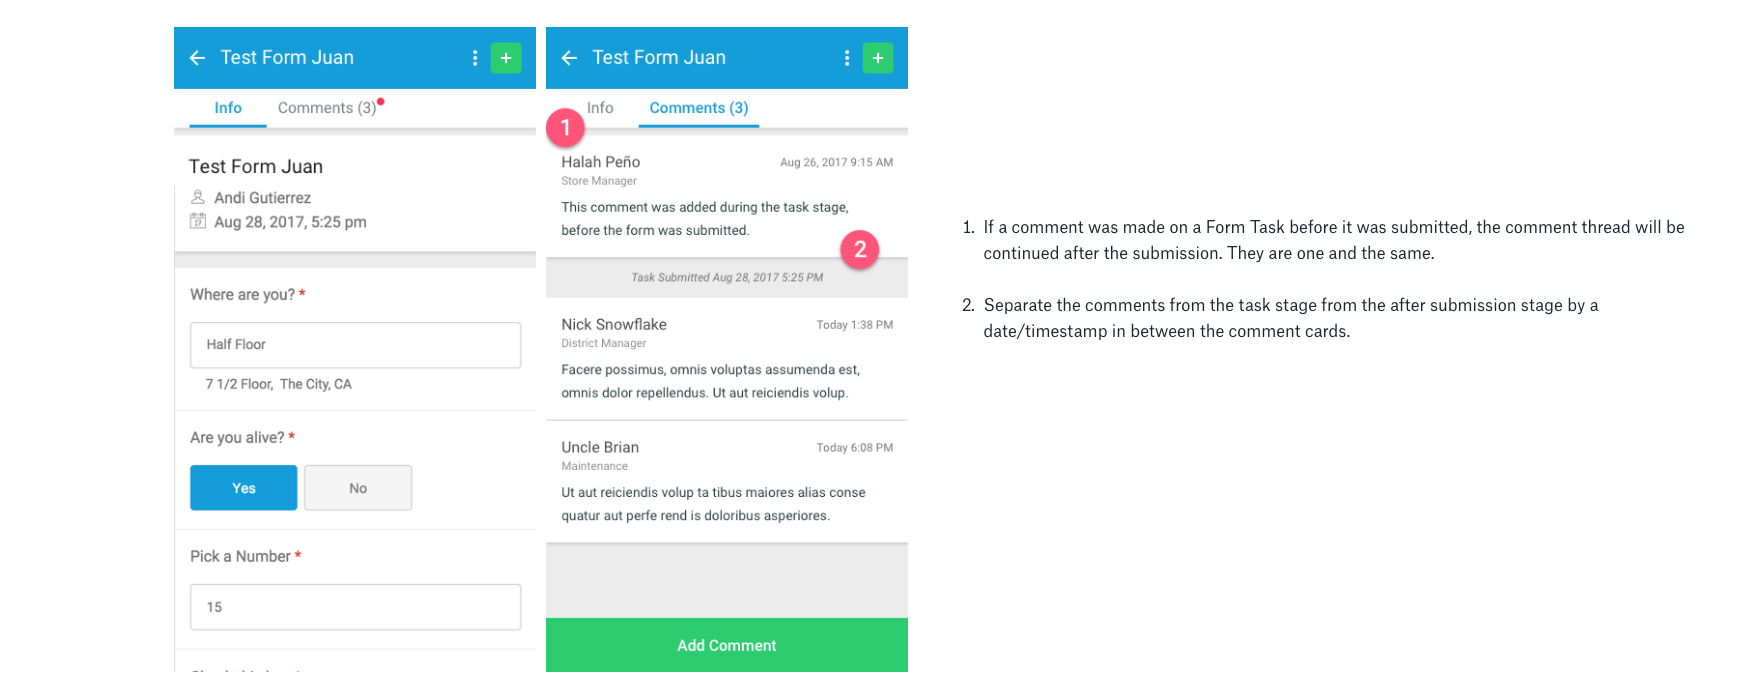
Modular Thinking
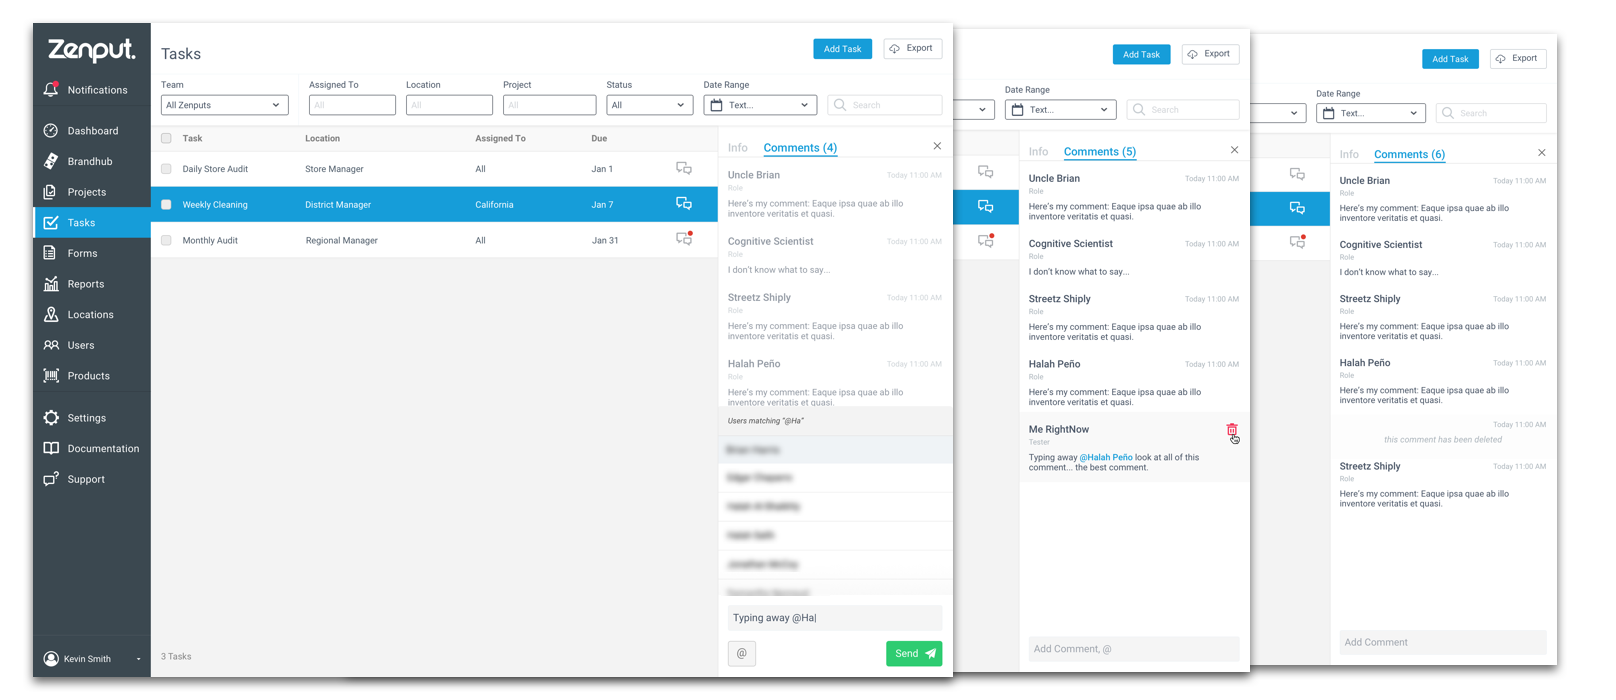
Our solution needed to work across multiple task types and environments, and fit into future designs, we decided on a modular approach to designing the commenting system. This way we could develop a comment component and insert it seamlessly anywhere within the app.
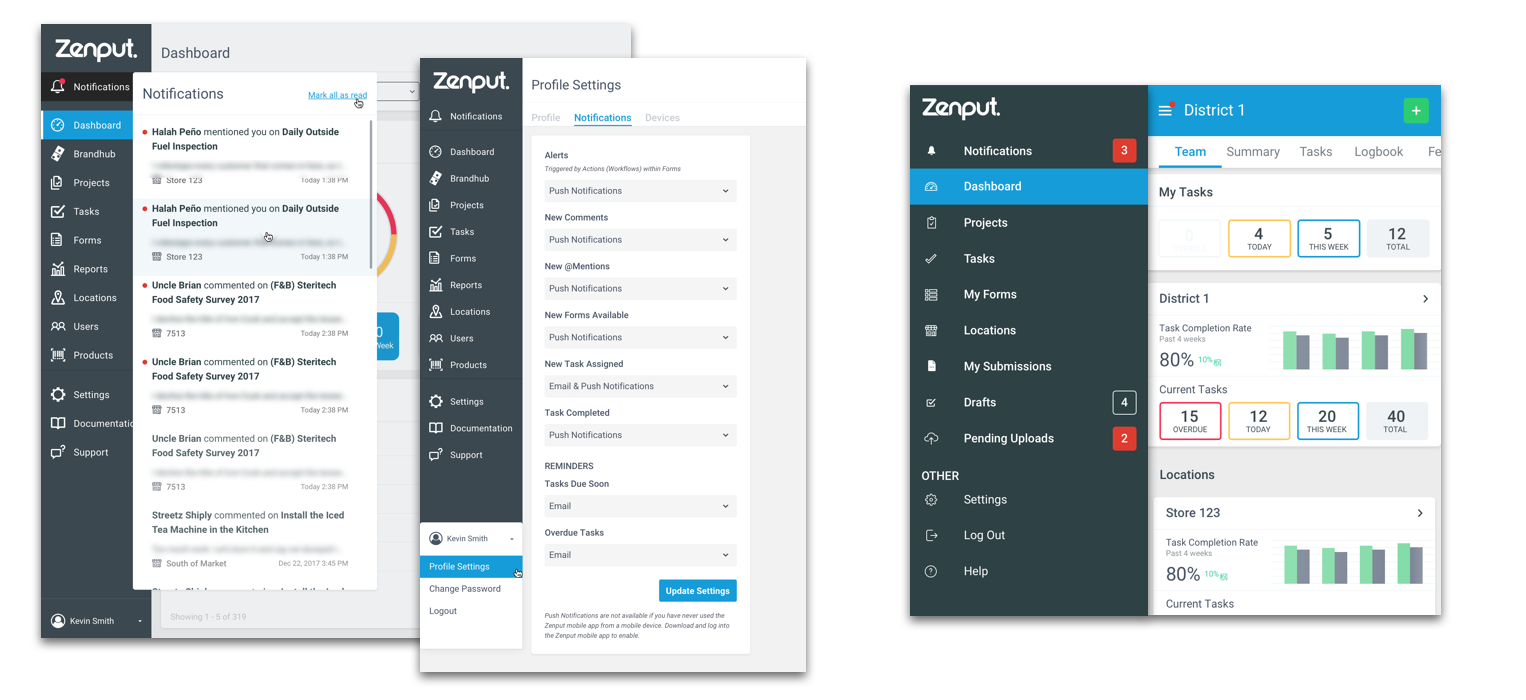
Notifications
One of the greatest challenges during the design process was how to approach the increase in notifications; users weren’t used to getting notifications from Zenput in such volume. Because we wanted to be sensitive to our users’ work environments and not get in the way of them getting work done, this brought up a number of questions:
Who should be notified?
Does the creator of the project or task get notified?
What if that user is the sole creator of thousands of tasks or projects? Will they get thousands of notifications?
Can users unsubscribe?
Are users unsubscribing from an individual thread or the entire notification type?
How much task/project context is needed in a notification?
How do we display notifications in app?
How much granularity over notification settings are we allowing users?
How do we re-prompt users who have turned off notifications in our mobile app?
Through research and analysis, we came up with specifications for how notifications were to behave in and outside of our application. Upon discovering several quirks and inconsistencies with our current permissioning, roles, and notification system across the webapp and mobile, we saw the opportunity to lay the foundation for a more holistic approach to how our notification system worked while designing our new commenting system.
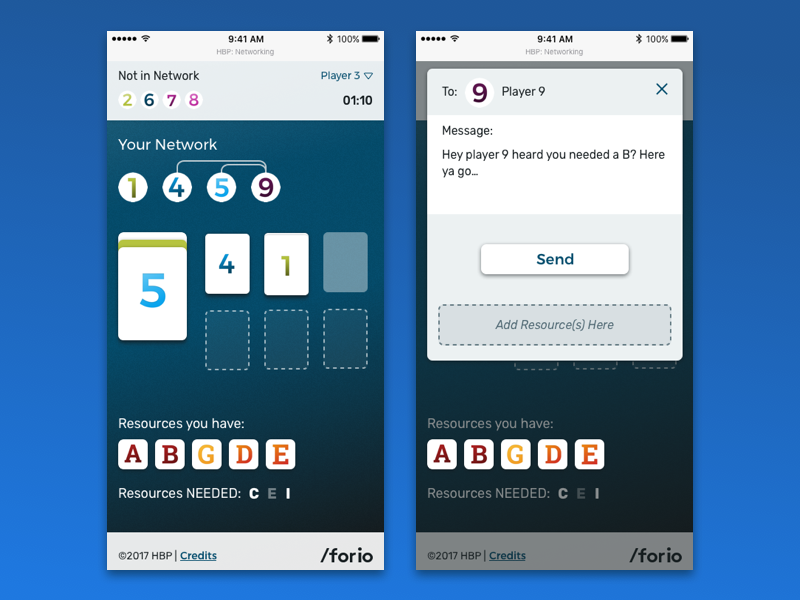
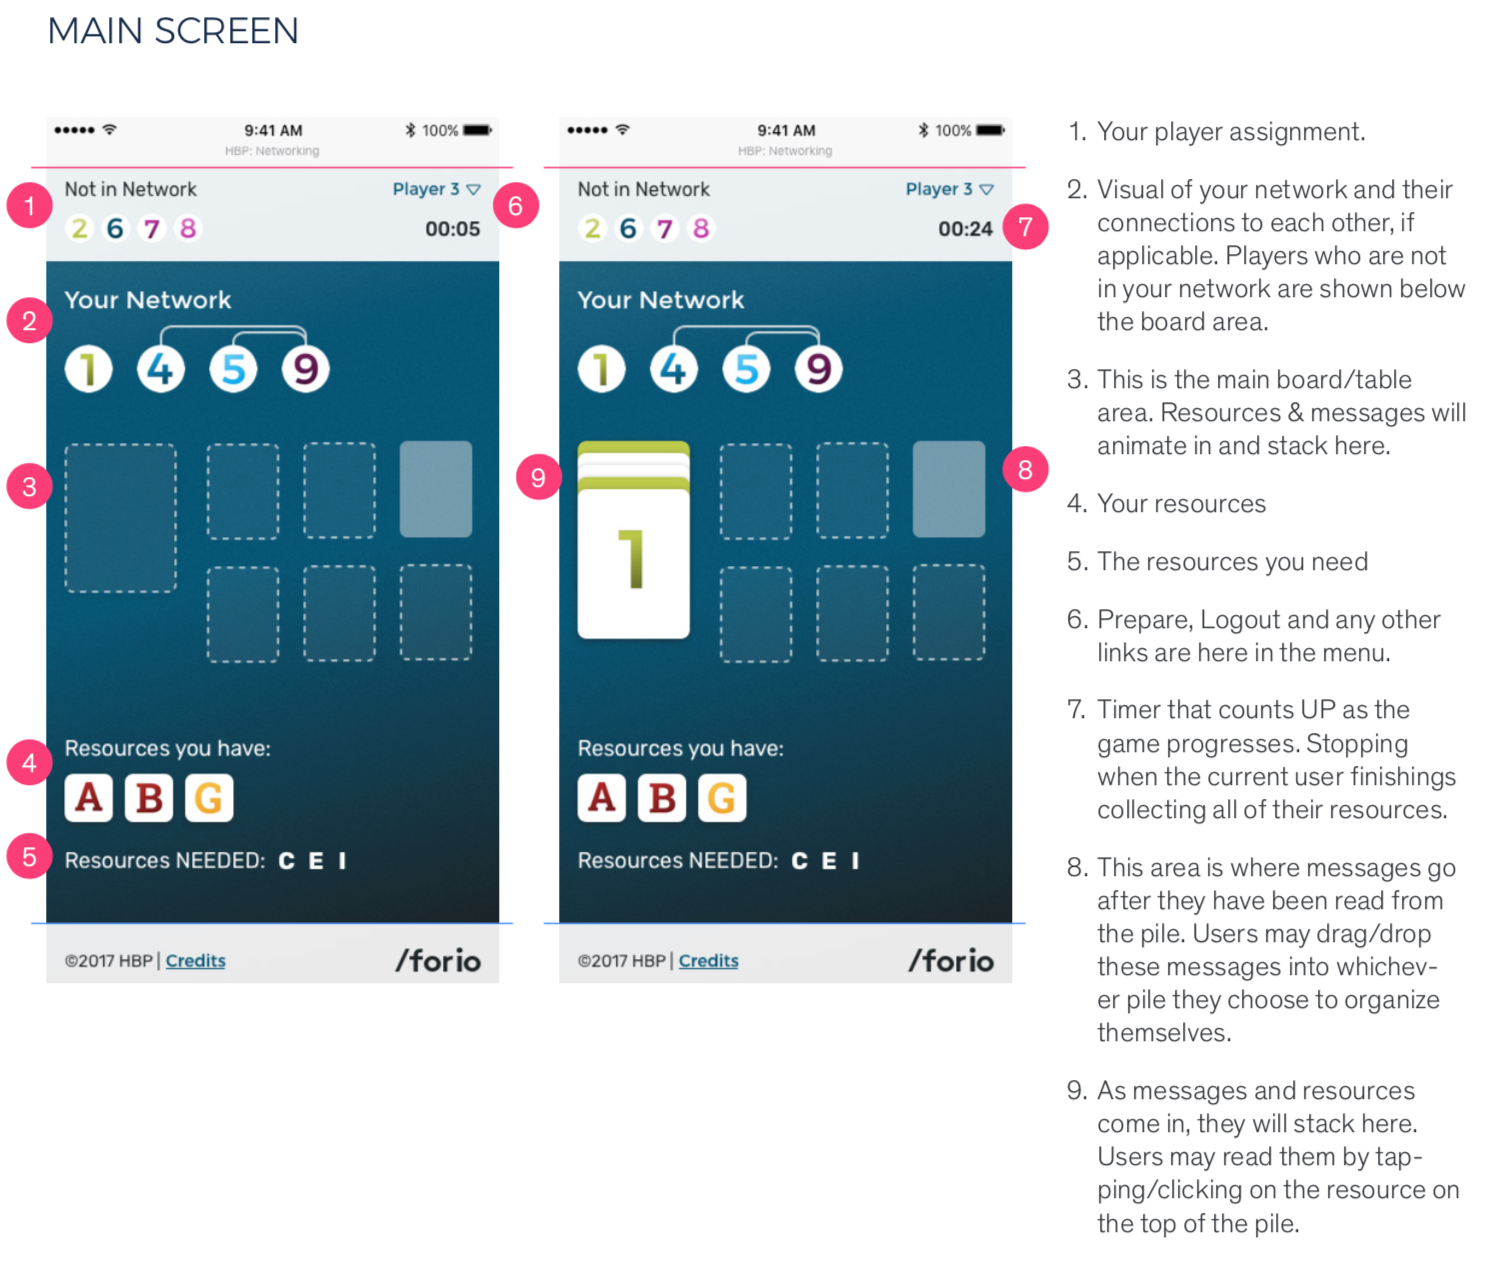
"This engaging 20-minute group simulation teaches students about the structural properties of social networks. Students are placed into networks of 7, 8, 9 or 10 people with the goal of obtaining certain key resources from their network as quickly as possible. Students can communicate and exchange resources with players they are directly connected to-but no one else. As the students work their network to find the resources they need, it becomes clear that certain players are in more strategically advantageous positions than others. The simulation teaches concepts including network structures and properties, social capital, reciprocity, power and influence, and the importance of networking."
Harard Business Publishing
Harvard Business School Publishing (HBP) asked us to turn a successful paper game, Networking, into an engaging, accessible simulation for both mobile and web. Challenges involved discovering the key learning objectives: How we would meet them in a digital version of this game while keeping the interactivity of the original?
The Game
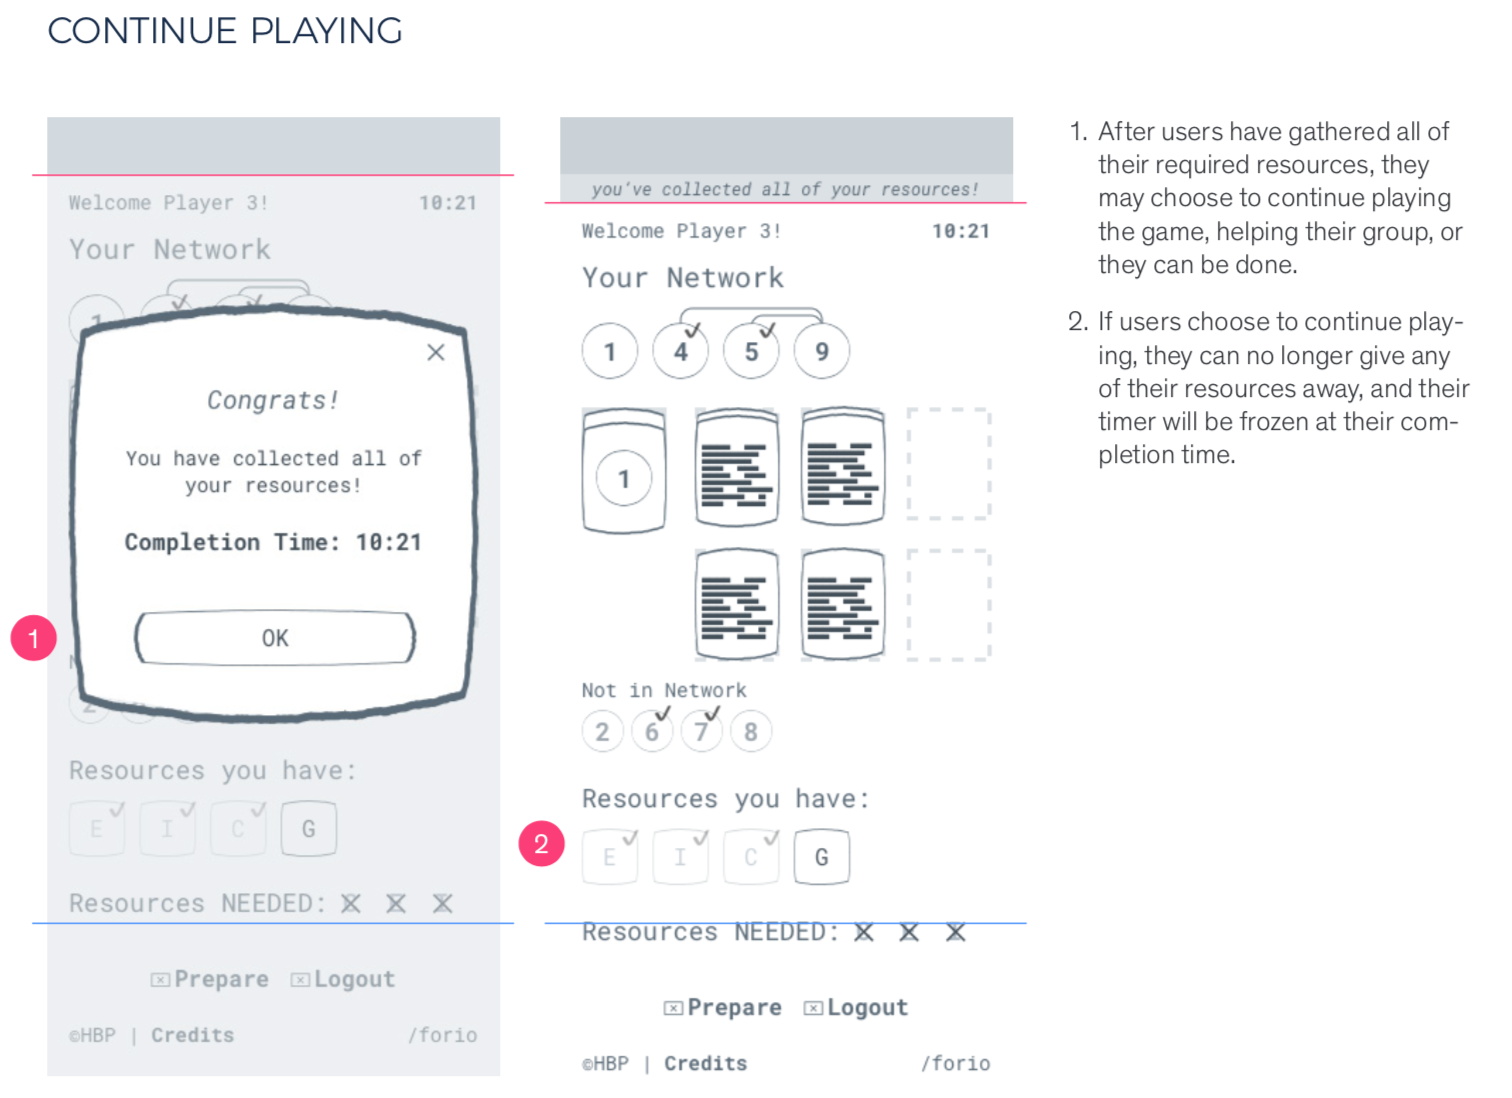
Players who finish early may choose to help others gain their remaining resources or not. The game does not end until the Facilitator ends it, or every player has finished collecting their resources
Process
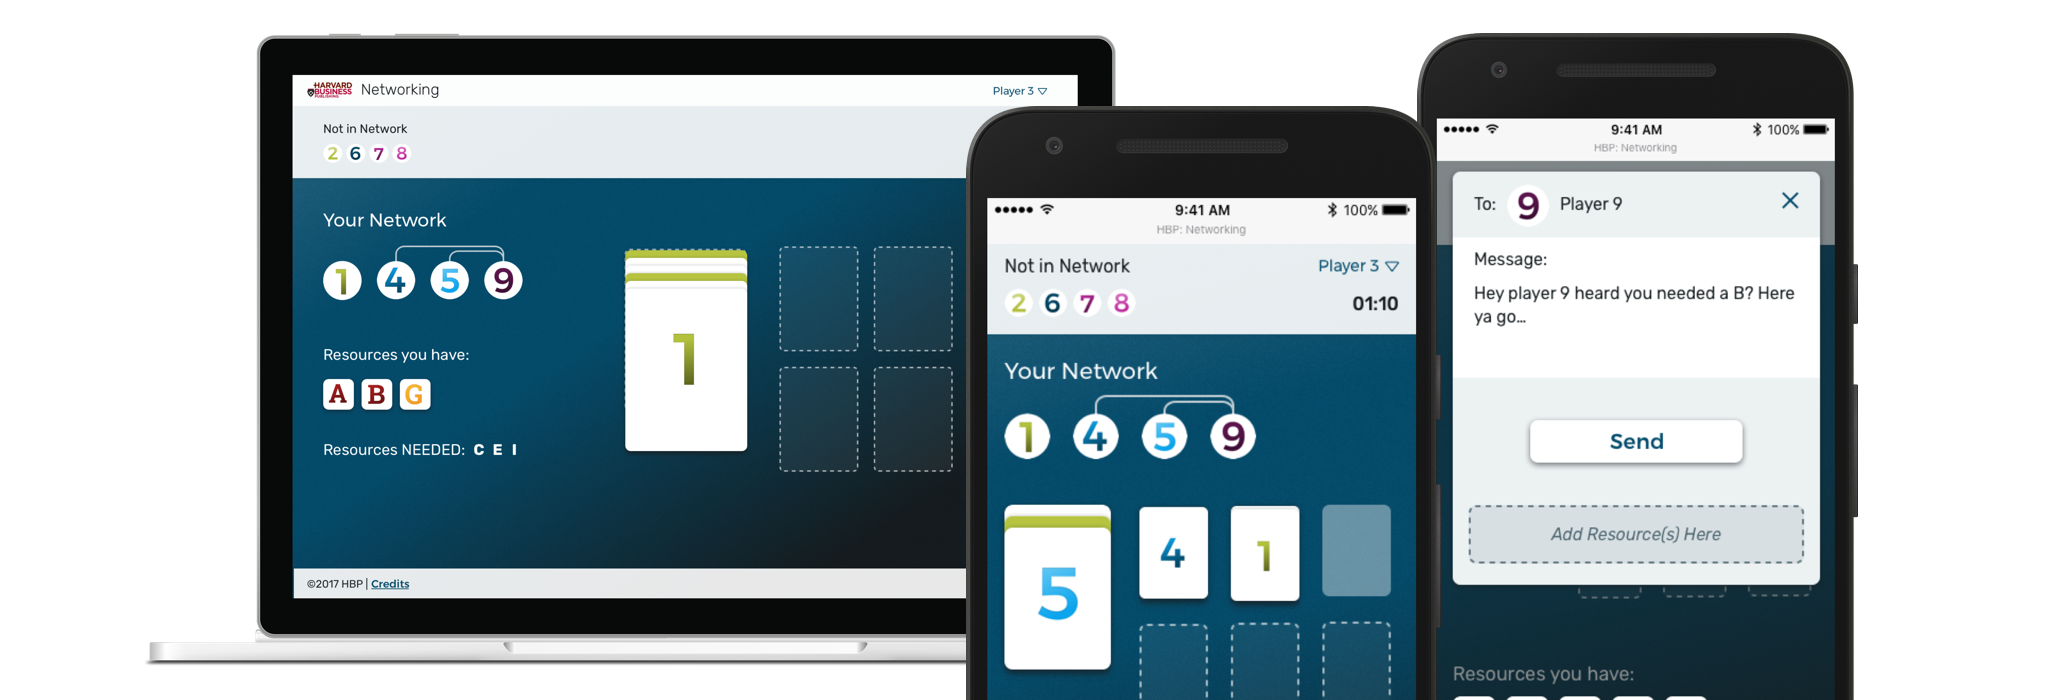
Having built a strong relationship with HBP and their team, I was able to promote a new process for this project. Using evidence from past projects, current design trends, and project goals, I convinced HBP to try a mobile-first approach. This streamlined the design process, allowing us to tackle the most difficult design constraints, interactivity, and accessibility on a small screen.
Learning Objectives
Demonstrate how the properties of one's network affect one's ability to derive benefits from it. Change perceptions of networking as selfish, opportunistic, or insincere by recognizing its benefits and potential for reciprocity.
The simulation needed to:
be as close as possible, without being skeuomorphic to the original paper game
take players about 10–20 mins to complete
have animated cards to keep it like the paper version, not cartoony but game-like
include networks, cover stories, number of players, paper version instructions, and demo (provided by HBP)
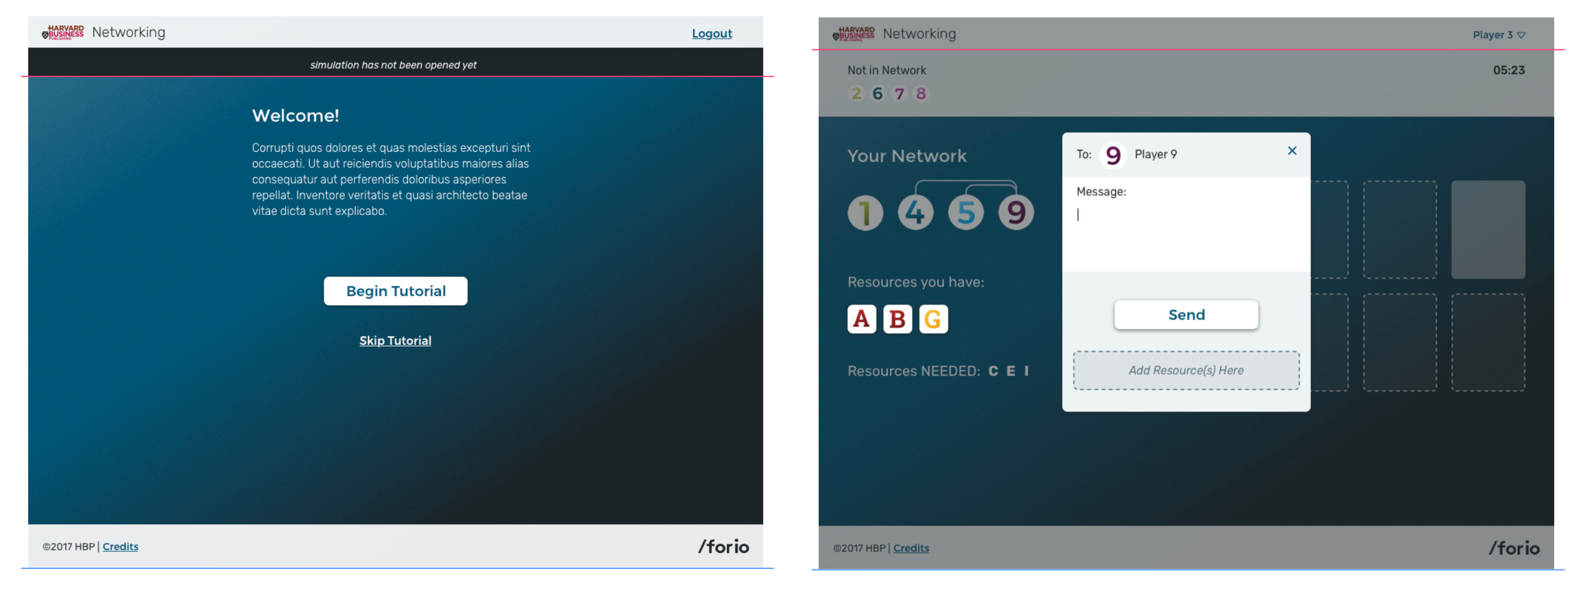
include an onboarding tutorial before gameplay
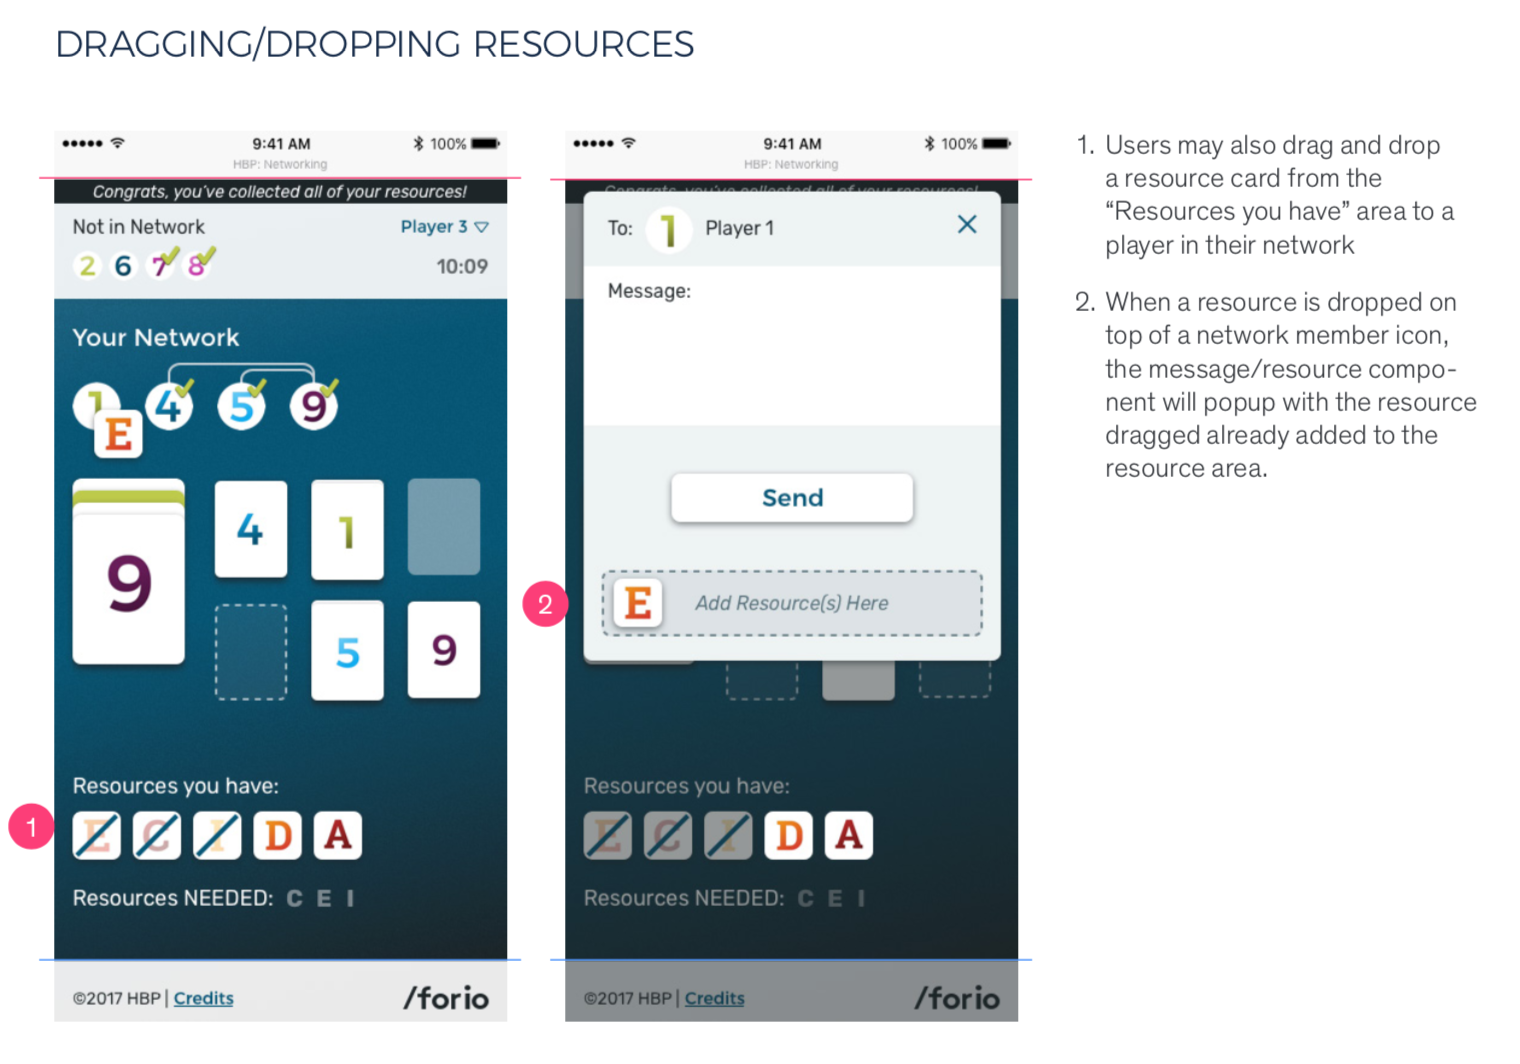
restrict messaging only to other players in the user’s network
allow players to see their own network—who they are connected to (if facilitator enables)
stack messages in piles similar to card games—the point is to “overwhelm” users with messages and resource requests, forcing them to choose how to react
include a timer to count up player time—this is how the game is scored
be available in mobile (iOS/Android/tablets) & desktop versions (single page webapp)
be WCAG 2.0 AA Accessible—exceptions must be documented & valid; we needed to be mindful of timing restraints, disappearing items/images, and ability to pause the game, as well as provide meaningful keyboard commands
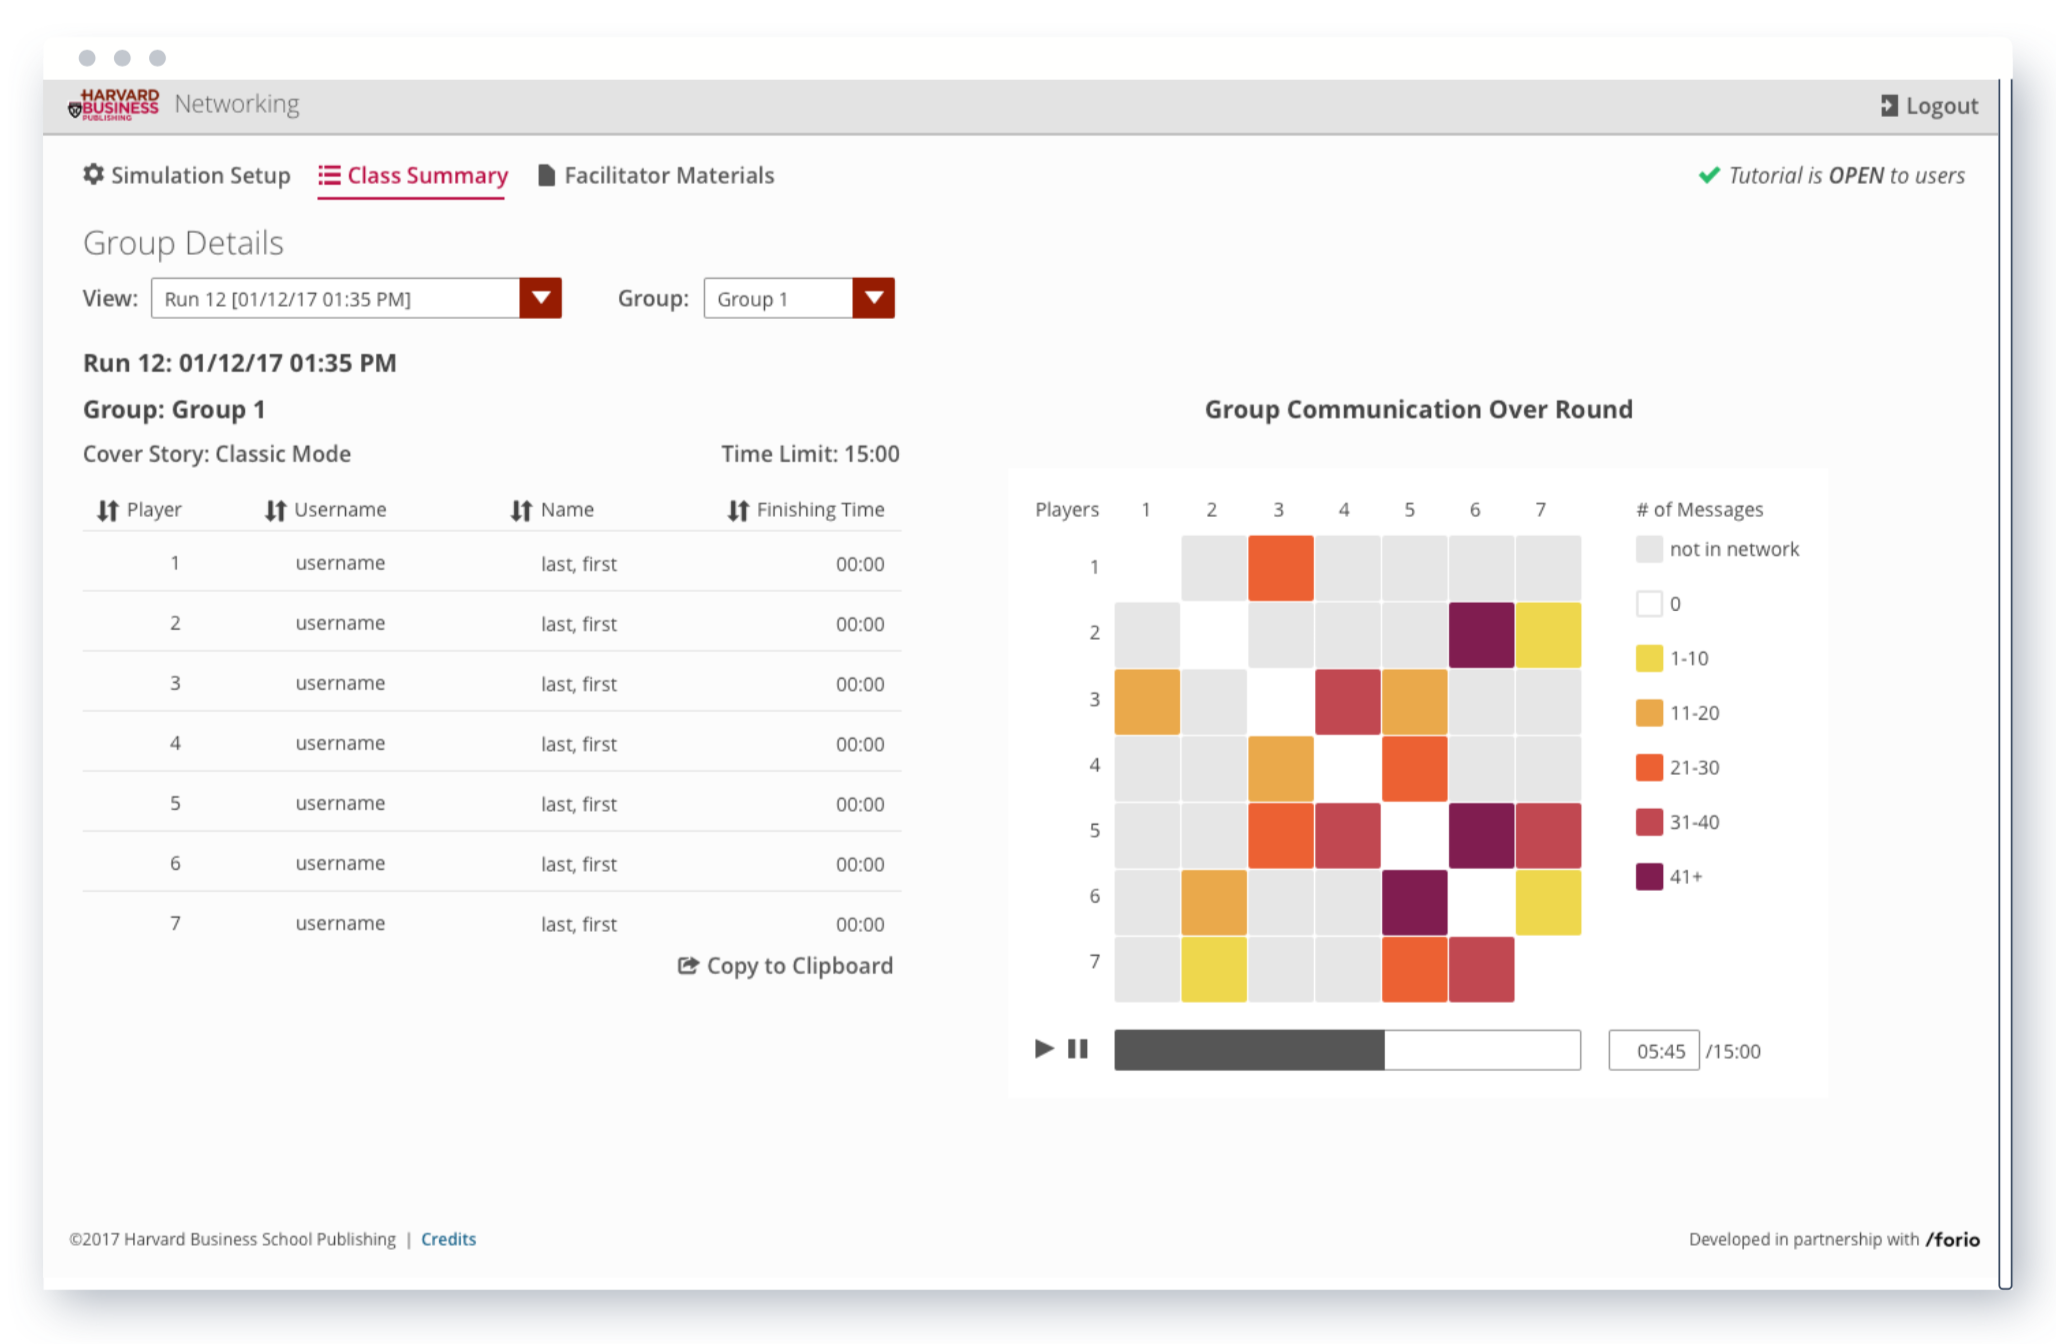
Facilitators additionally needed to be able to:
view user results/score
access a heat map of messages throughout the game
choose whether or not to reveal the networks to players
set an end time limit or leave it open ended/facilitator controlled
select from multiple cover stories
assign users & create teams automatically or manually
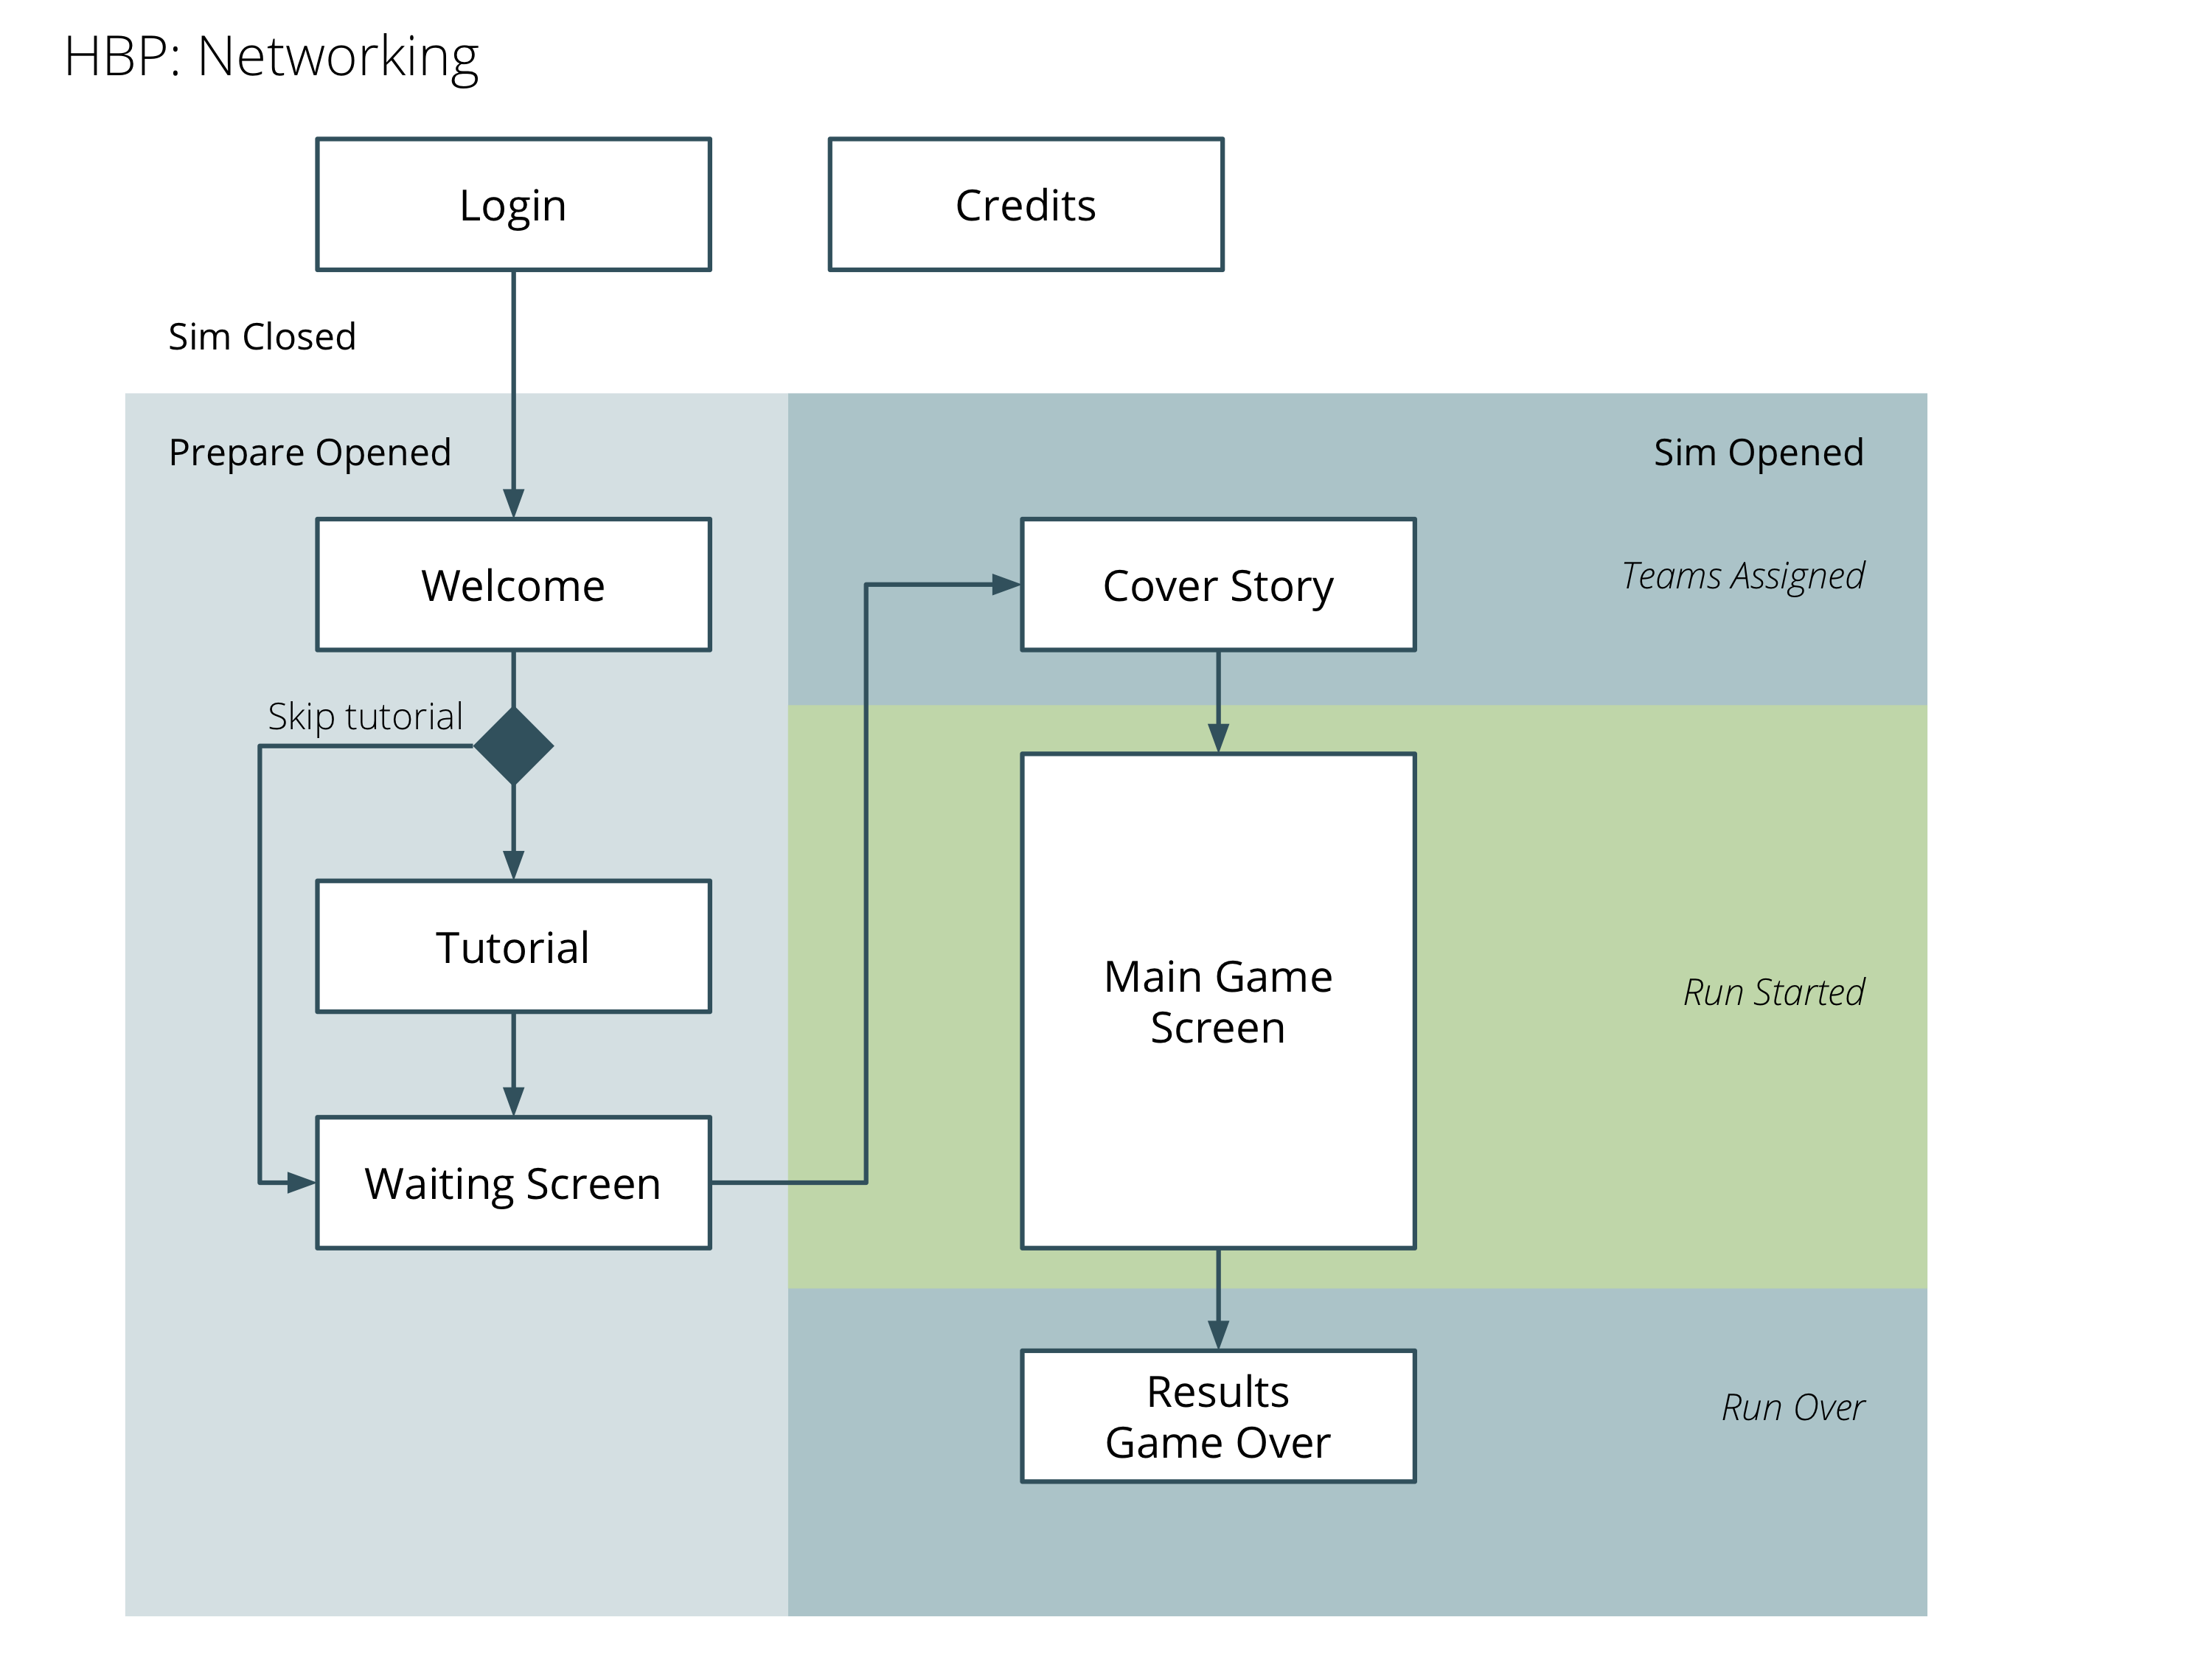
UX & Information Architecture
Players need to be able to login, read the preparation information, and complete the tutorial when the facilitator enables “Prepare Mode.” Once the simulation is opened, users may read the chosen cover story and prepare for the game while the facilitator assigns teams based on the number of logged in users. Once the run has begun, users are taken to the main game screen to begin play. Users see the results screen for everyone in their cohort once the run has ended.
Wireframing & Low Fidelity Prototyping
Wireframes allowed me to determine and test the simulation flow, gameplay, and interactions. This was a highly iterative stage of the process where there was a lot of communication with the HBP team. It was also the first time we performed paper prototyping playtests.
One of the greatest challenges during this stage was creating the feel of the paper game with interactions that made sense in a small, touchscreen environment. I ended up landing on a layout similar to card games found on mobile, like Solitaire and Uno.
High Fidelity Mockups & Visual Design
Differing from past HBP simulations, this game’s visual/UI design played a large role in creating a successful digital version of the original game. HBP wanted to keep the look of cards (in the paper game, they use sticky notes) but didn’t want to date the webapp by using too skeuomorphic of a design. They were also interested in having “fun” animations to drive the concept home.
Finding the delicate balance between creating an engaging, fun webapp that is still mature enough for our Harvard Graduate Business School audience has always been a challenge. To combat this, we used a more traditional agency-style visual design process that HBP really ended up loving. I created mood boards, various styles, and animation examples for us to discuss and review together.
Results
Networking was a milestone in how I approach designing a complex project collaboratively with a team. The process we set in place for this project proved to be successful—it was focused, iterative, and had clear expectations on all sides, allowing us to have a clearly defined and well tested product before heading into development.
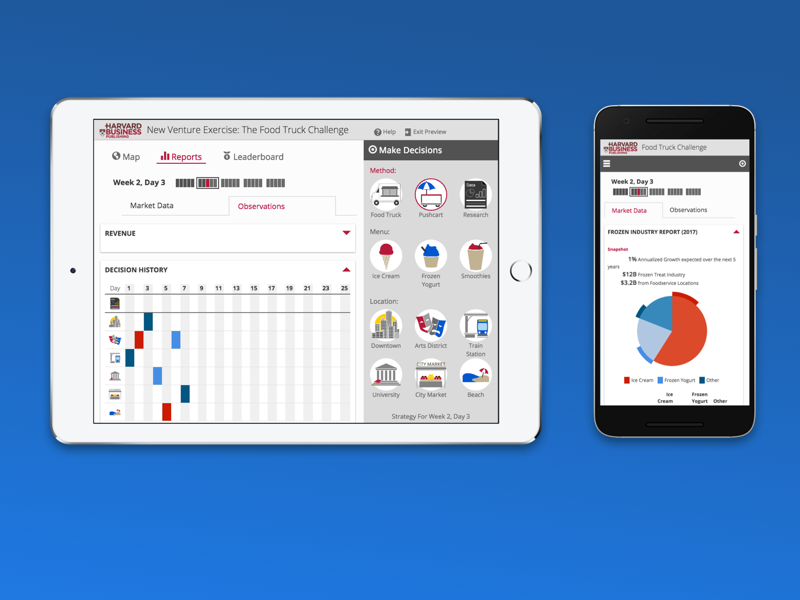
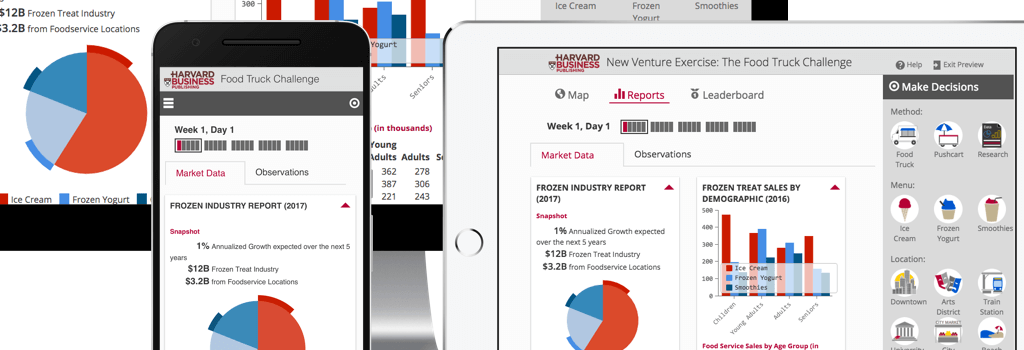
Food Truck Challenge for Harvard Business Publishing (HBP). This was the first responsive, mobile-first, accessible (WCAG 2.0 AA) simulation created for HBP, and is used by thousands of MBA students a year.
Currently listed as one of HBP's Most Popular simulations!
“In this online simulation, students try to run a successful food truck in the city of Boomtown. Students work individually or in teams to achieve maximum revenue over 5 simulated weeks and win the "Food Truck Challenge." This simulation teaches students about the value of learning by doing, prototyping, and willingness to fail. It is ideal for discussions of innovation, product development, design thinking, lean startup, entrepreneurship, strategy, marketing, and organizational learning. It requires no student pre-work and can be played in 20-30 minutes on a computer, tablet, or mobile phone.”
Harvard Buisness Publishing
Professor Michael Roberto, author of the award-winning Everest simulation, presented us with the concept for the Food Truck Challenge. He wanted a simple, effective simulation that would teach the concept of minimum viable product (“MVP”) to students in a short, engaging, and easily repeatable format.
This idea was a departure from many of our other popular Harvard Business School Publishing simulations, which are typically meant to run for an entire class period or over several days. Professor Roberto wanted an exercise that could be run in 30 minutes or less, while still providing the impact of a longer, more complex simulation.
The primary challenge in developing this simulation was modernization: the simulation was originally developed by Enspire Learning and built using Flash technology in the early 2000’s. Professor Janice Hammond and Harvard Business School Publishing wanted to refresh the content, design, and technology while keeping the same feel and user experience. Our design and development teams were able to deliver, taking the original experience and reimagining it for tomorrow’s business students with an updated design and modern web technologies.
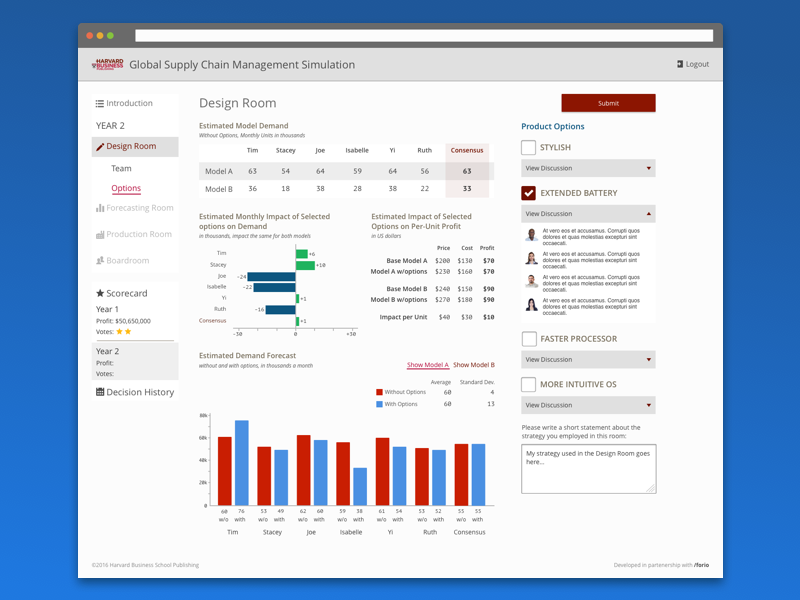
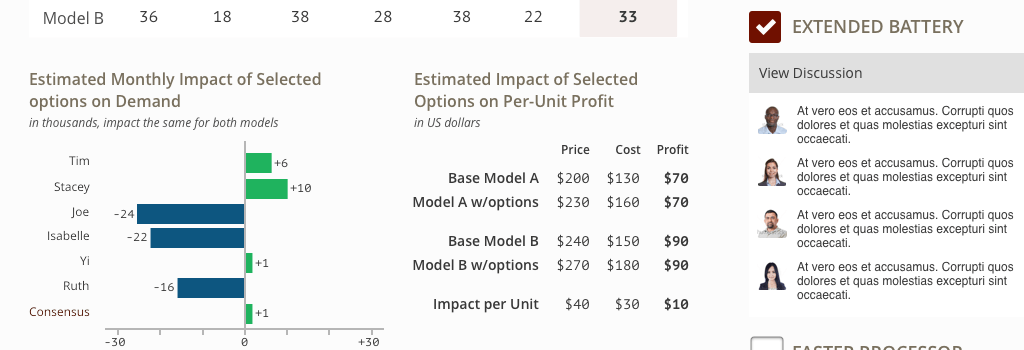
The Global Supply Chain Management Simulation is designed to teach intermediate to advanced concepts in supply chain design, demand forecasting, resource allocation, and production planning. The simulation gives students an opportunity to design and manage the supply chain of a global phone manufacturer.
NEW for V2: Our revised version of the Global Supply Chain Management simulation includes: Updated interface with new images; Modernized features in the product line managed by students; More diverse set of actors; Compliance with the Web Content Accessibility Guidelines 2.0 AA.
Harvard Buisness Publishing
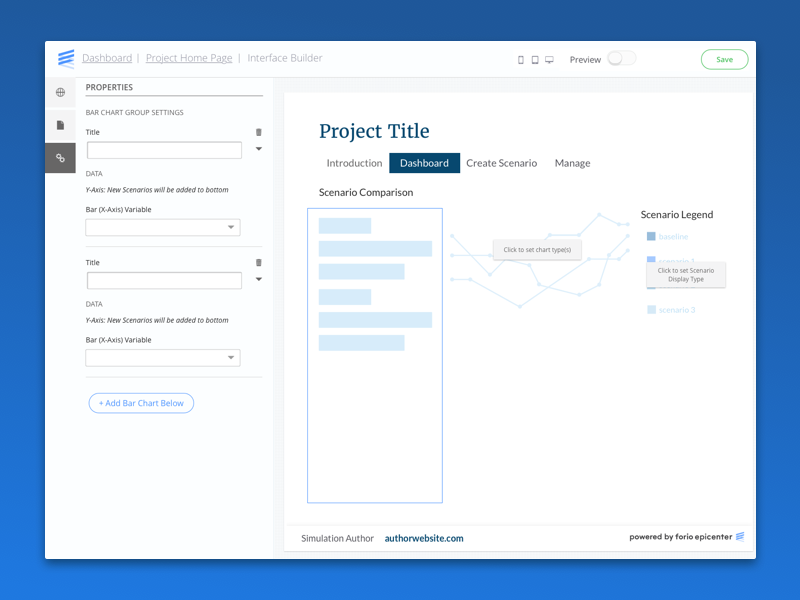
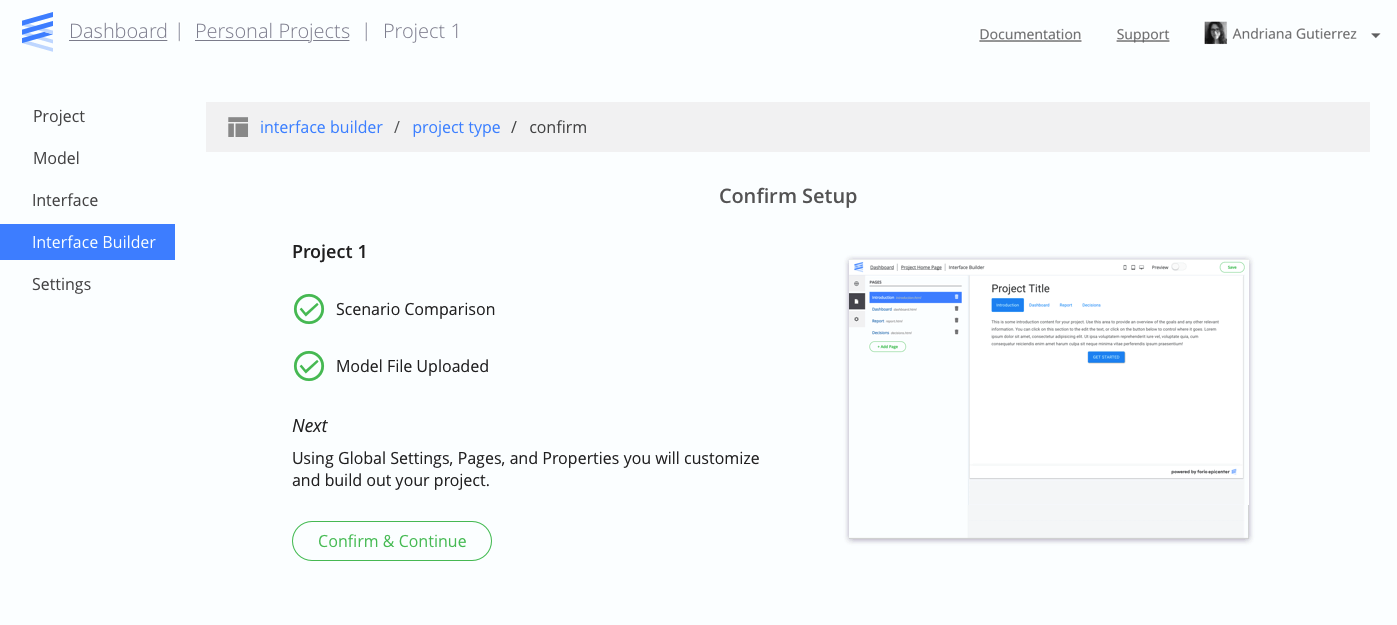
Epicenter's User Interface Builder is a tool that allows analysts to easily design an interface for their dataset or model. Currently in public beta, this product is still in development at Forio. My challenge has been to come up with components, themes, templates, and workflows that are scalable regardless of possible new features and settings. Since I enjoy solving complex puzzles, this was a challenge I eagerly accepted.
"Epicenter’s Interface Builder is an amazingly fast and simple way to create beautiful modern interfaces for your model."
Forio
Forio had an existing product called the User Interface Builder, originally built for Simulate, a flash-based modeling and simulation product. A new version of the UI Builder was created for Simulate’s replacement, Epicenter, using modern web technology. This very freeform, drag-and-drop version didn’t get fully realized and was never quite finished or usable. My job was to design the next iteration so that users could easily build a working simulation to share.
In terms of design, the UI Builder needed to:
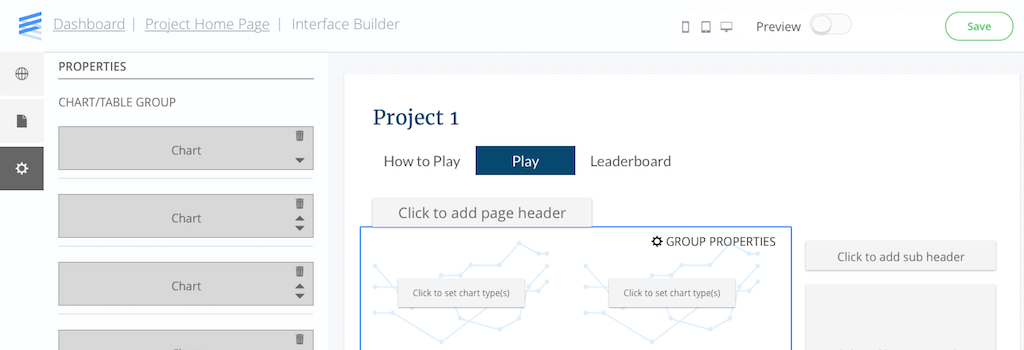
be able to easily & quickly build our most common simulation types
be templated—guide users into creating more thoughtful designs
be modular—restrict the parts of the UI that can be changed
offer multiple page types like introductions, dashboards, reports, and run comparisons
use common components for charts, tables, histograms, and decisions
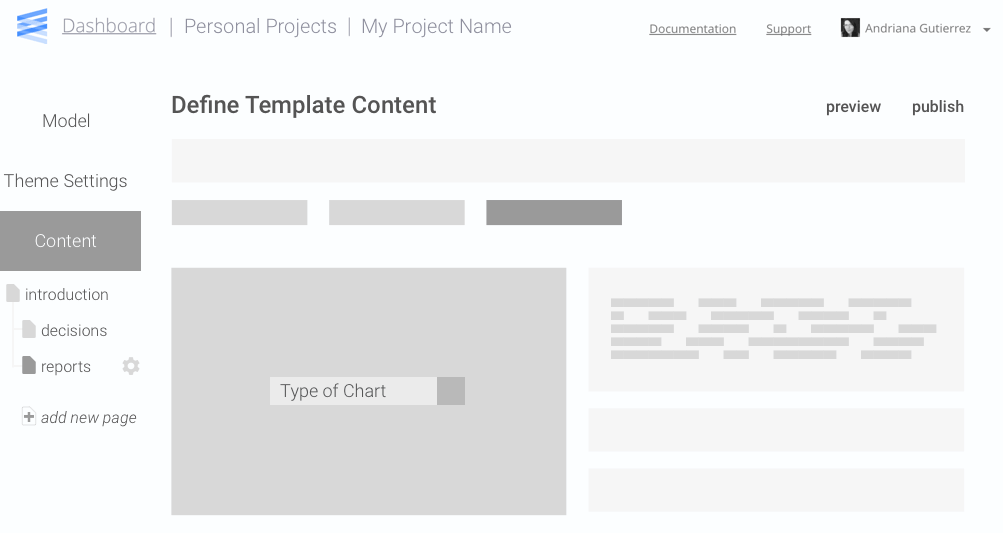
be themeable—users should be able to choose a desired theme
be customizable—users should be able to easily customize their projects using themes, colors, fonts, and/or layouts
Process
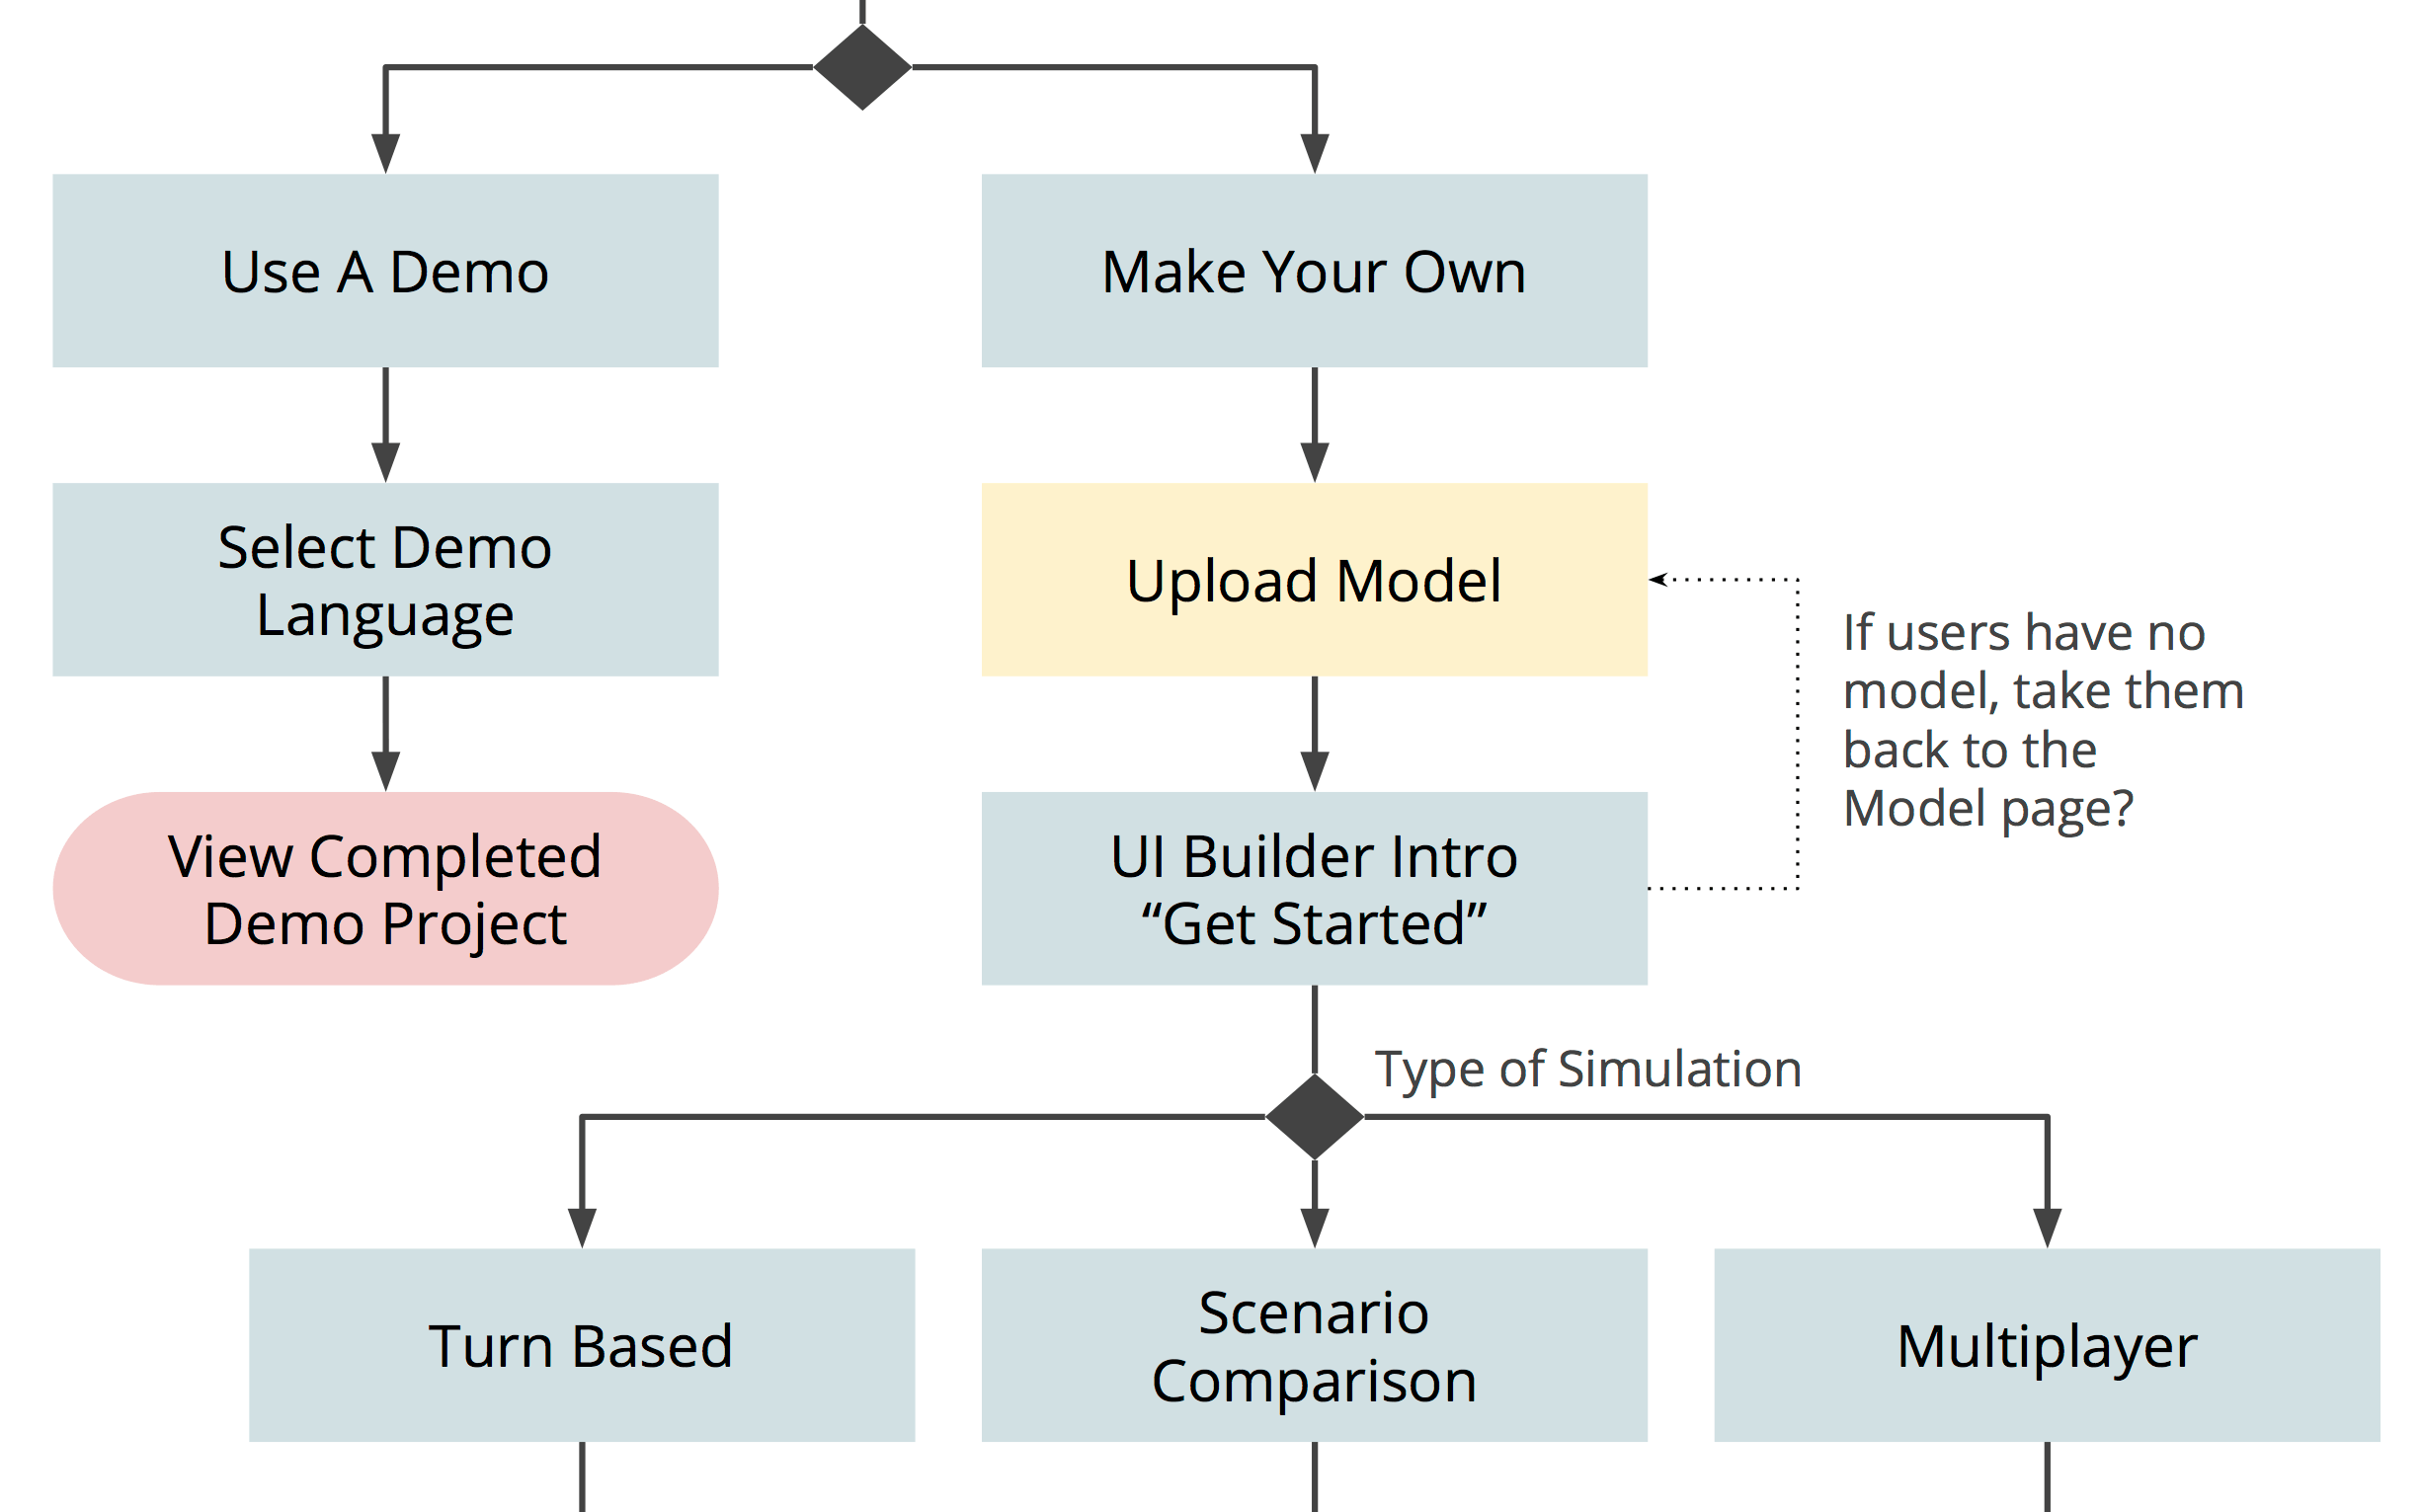
After a couple of meetings to discuss product requirements with the team, I began by organizing a list of desirable features, grouped by functionality into categories. This provided an overall structure of how users would go about creating a simple turn-based simulation. From here I was able to organize an architecture and begin sketching out a basic user flow. Frequent iterations of this flow were drafted informally with my design lead and formally with the entire team, and through those meetings we agreed on something similar to the following:
New features were being discussed and added to the list frequently, creating a bit of chaos and requiring me to think systematically and design for scalability. This mode of thinking allowed me to come up with a layout and flow that could be built upon regardless of what new features and settings would be added to this product in the future.
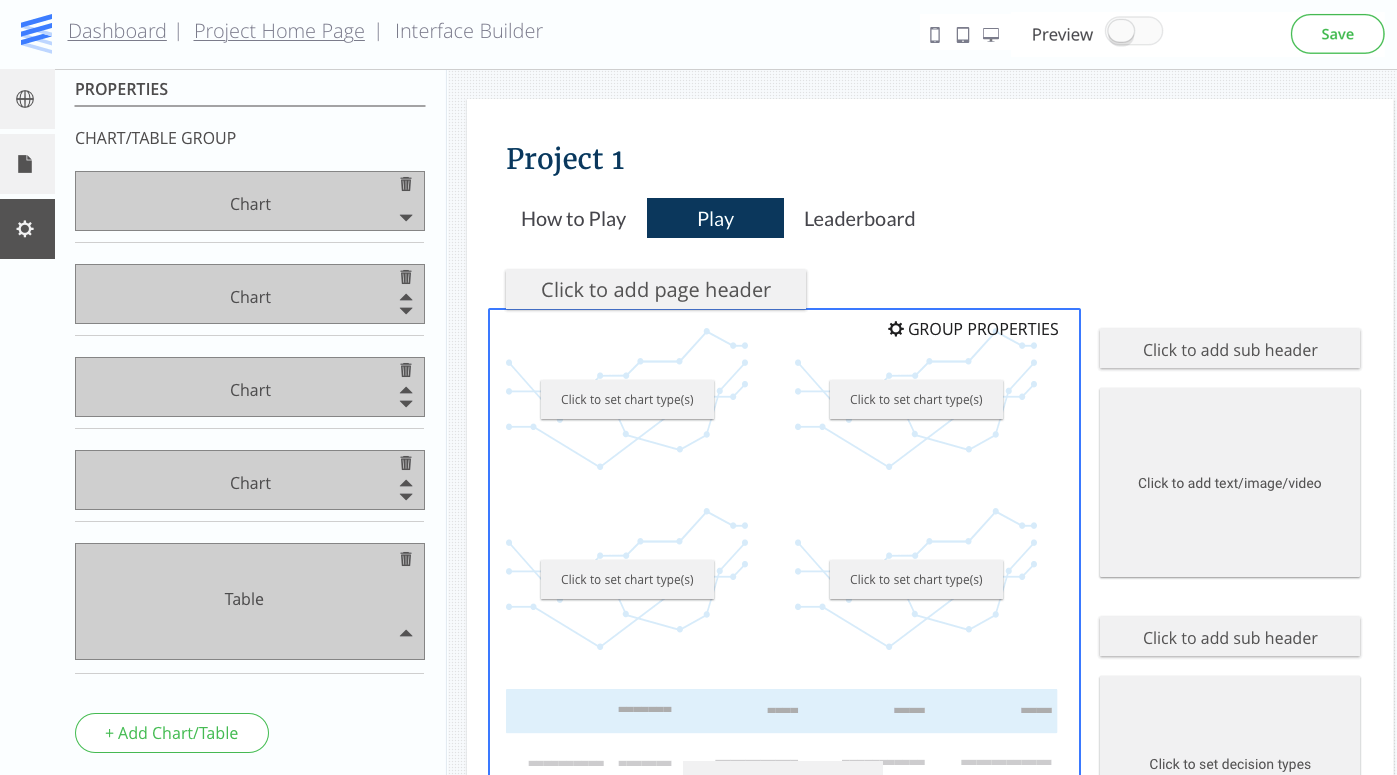
As we progressed, I moved wireframes into InVision prototypes, then onto higher fidelity mockups/prototypes. I needed to match the Epicenter branding at the time and make the UI Builder feel like an extension of that product. It was challenging and rewarding to come up with new styles and ways to build upon current components.
Throughout the design process, our platform team extended APIs and built new dependencies to support the UI Builder, while the front-end team worked on architecting and structuring the build. Once a front-end build was in place, I worked with the dev lead to discuss implementation and work through constraints.
Results
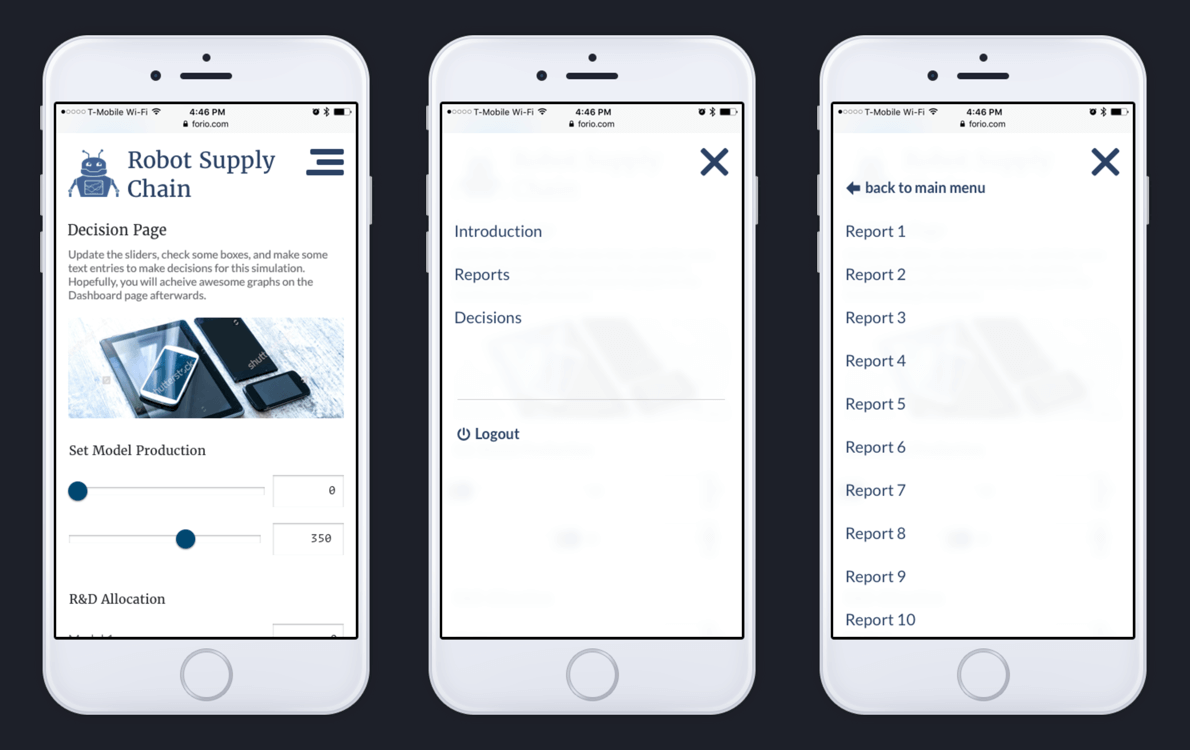
After a well-received ALPHA, our BETA version was released in late 2016. This project has continued to evolve as we get more testing data and platform updates, add features, and refine the currently implemented ones. I've even taken up coding new templates and adjusting themes for mobile end users!
Checkout this mobile menu concept created using InVision 👉 here.
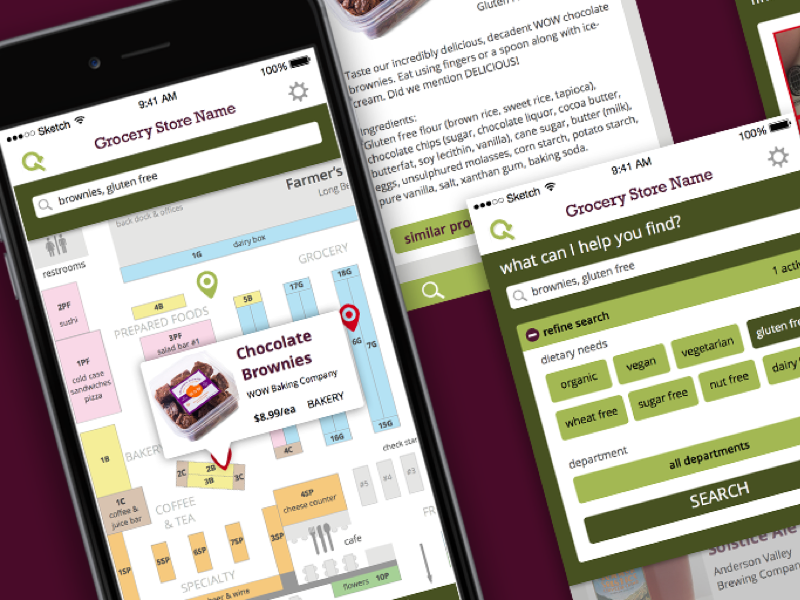
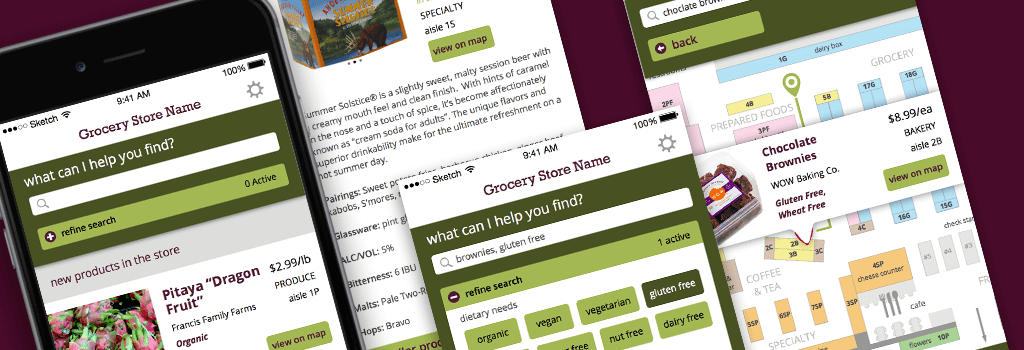
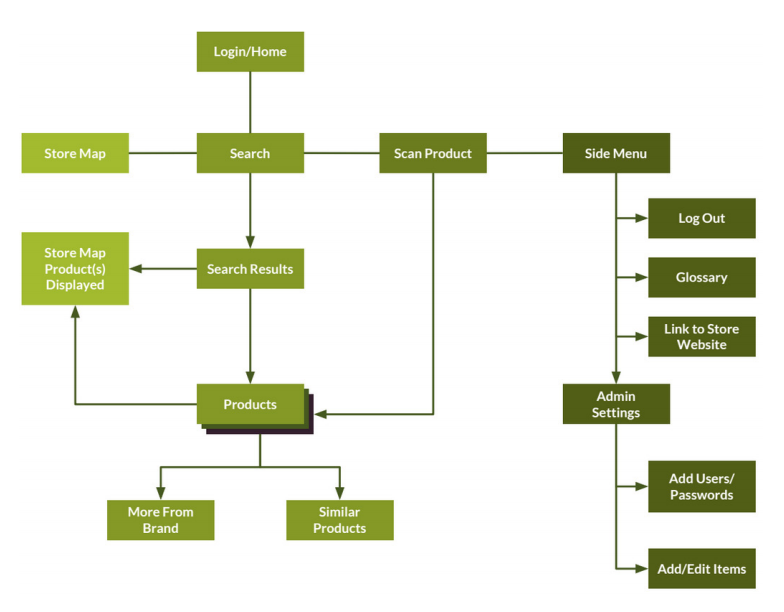
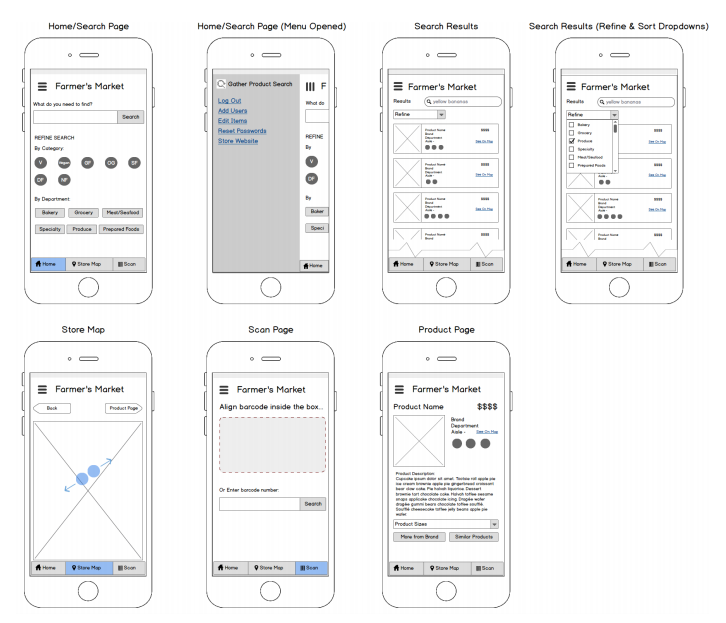
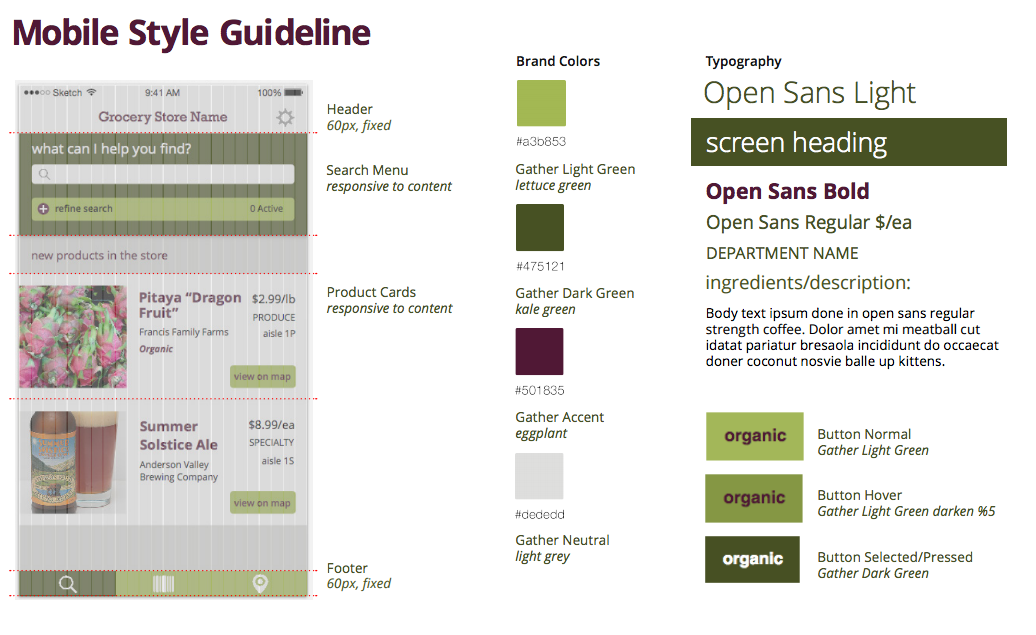
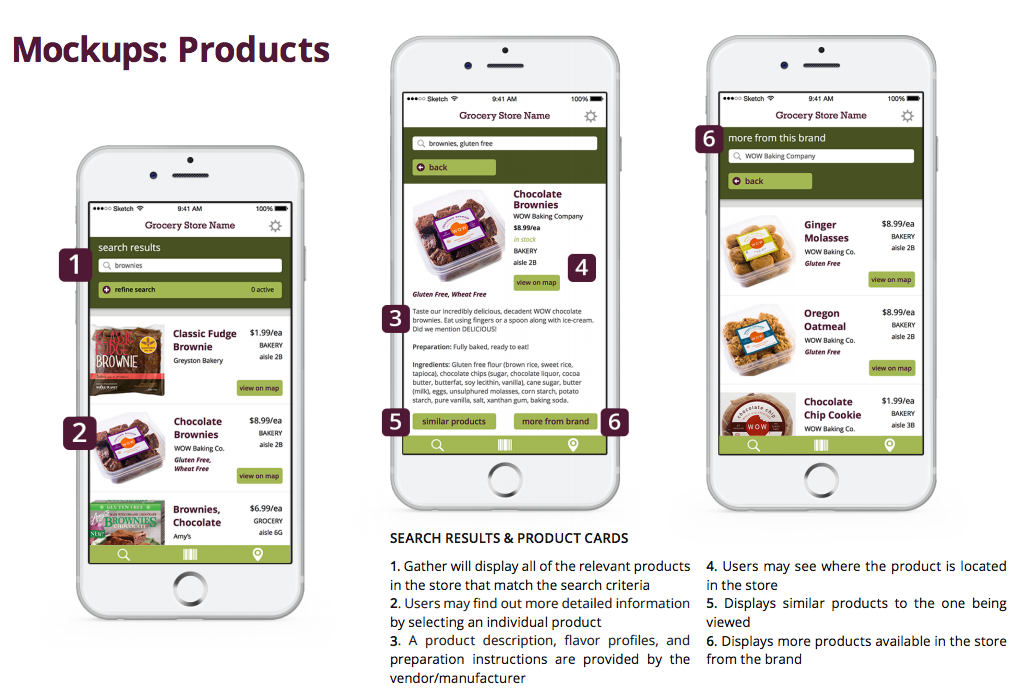
An employee’s product knowledge is an important selling tool and asset. Specialty grocery stores add new products weekly and are ground zero for new diet trends. Gather is a mobile application that enables employees to answer customer questions more efficiently; building credibility and store loyalty while boosting sales and educating themselves at the same time. Project completed Summer 2015.